Bitcoin liquidations explained: Riding the market’s wild waves

A few weeks ago, the crypto world was shaken. Headlines screamed, "$19B Wiped Out in Crypto's Biggest Liquidation Ever," after Bitcoin took an abrupt plunge. Behind these headlines is a powerful, often violent, market mechanism that acts like a pressure release valve — and understanding it is key to reading the market itself.
What is a BTC liquidation?
To see how this happens, we first need to look at the engine of this volatility: leveraged trading. Unlike simply buying and holding bitcoins, investors borrow massive amounts of capital to place oversized bets on where the price is headed next. It's a high-stakes game, and liquidation is the moment the house collects its debt.
News like "$300 Million in Crypto Liquidated as Bitcoin Crashes," primarily refers to forced closures of leveraged long positions in perpetual futures (perps) and traditional futures contracts. The mechanics are the same for both, but perpetuals are the main culprit due to their popularity and high leverage.

Futures are a type of derivative — financial instruments mirroring the value of an underlying coin to offer indirect exposure to crypto's rollercoaster prices. A derivative is a binding financial contract between a buyer and a seller. The fine print can force the buyer to purchase or the seller to sell an asset, with (traditional) or without (perps) a set date and price.
Futures are famously traded with leverage — meaning traders can borrow big to supercharge their positions and pocket larger potential profits. For example, with 5x leverage, a $2,000 deposit can unlock a $10,000 contract.
Perpetual futures often turbocharge this further with 10x, 20x, or even sky-high leverage. This very same mechanism can magnify losses in a flash if the market turns sour.

To jump into derivatives trading, you must first deposit an initial margin and then maintain a separate maintenance margin. This financial cushion allows traders to weather losses up to a certain point — before the reckoning of liquidation is triggered.
When liquidation hits, the exchange forcibly closes a trader’s position to prevent their account from plunging into negative territory. Here’s the blow-by-blow.
How does the liquidation hammer fall?
Liquidation strikes when a trader's losses swallow up both their initial and maintenance margin. In simple terms, their margin balance is too low to keep the position afloat because the market has moved sharply against them.
Imagine you’re holding BTC perpetual futures. If the price moves against you, it erodes your margin ratio. The moment it hits the exchange’s liquidation threshold, the platform automatically pulls the plug.
This process is swift, brutal, and often happens on a massive scale.
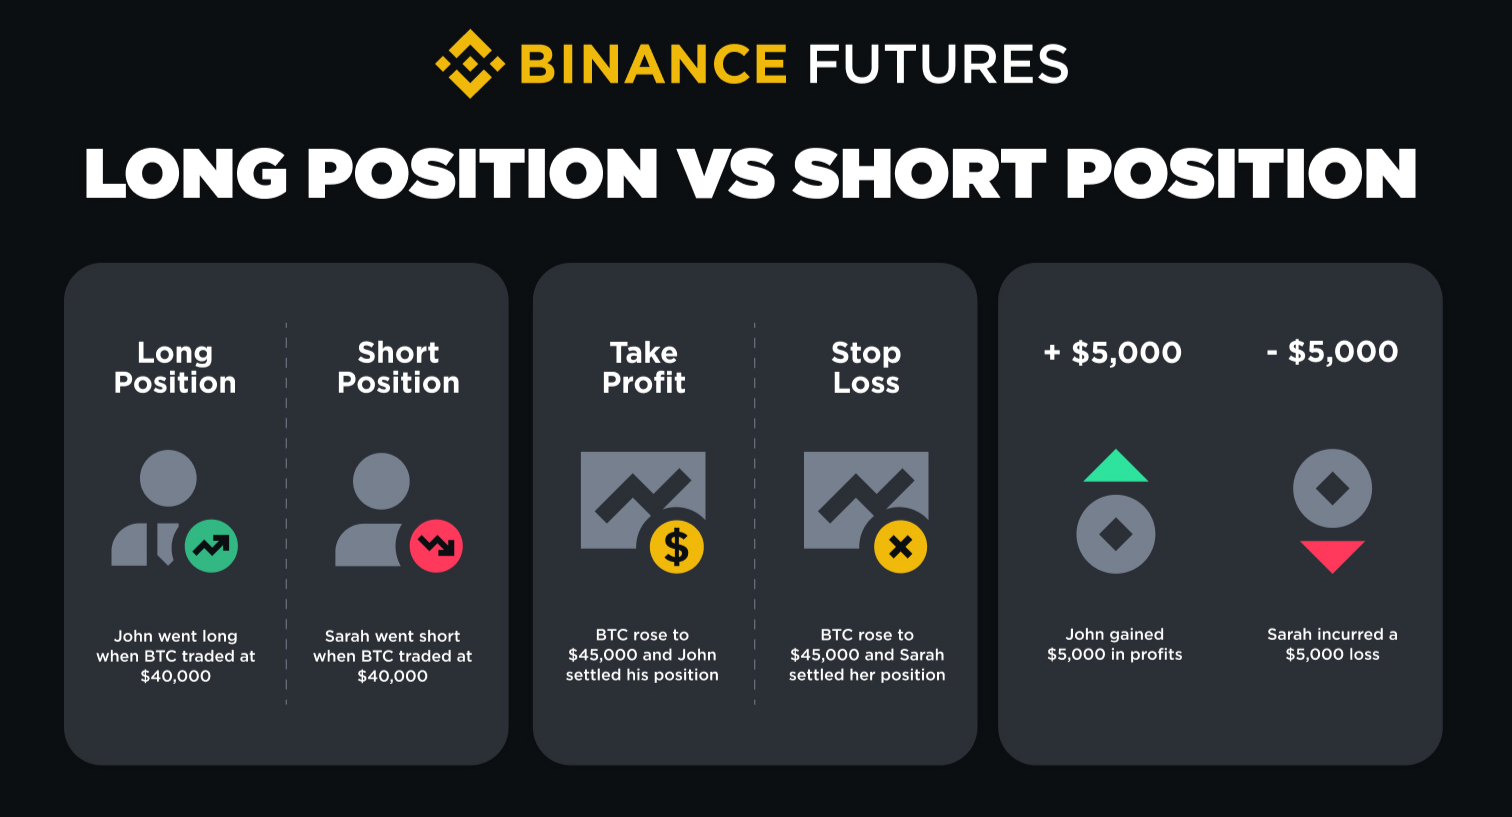
Liquidations come in two flavors: long (for the optimists betting on price surges) and short (for the pessimists betting on a slump).
Short squeezes and the domino effect
Long liquidations are sparked by nosediving prices, wiping out bullish traders. Large-scale long liquidations often reveal a market that was blinded by greed before succumbing to panic selling.
Short liquidations, on the other hand, are ignited by surging prices, torpedoing the bears. When they happen en masse, it’s called a "Short Squeeze" — a painful scenario where fierce bearish sentiment is overwhelmed by a frenzied rally.
On a grand scale, liquidations can create a vicious cycle known as a liquidation cascade. It’s a self-feeding frenzy:
- A price reversal sets off the first wave of liquidations.
- To close those positions, exchanges dump (or buy) assets on the open market.
- This forced selling or buying propels the price even further.
- Suddenly, more leveraged positions breach their liquidation thresholds, unleashing a fresh waveof liquidations.
Liquidation data as a sentiment barometer
Real-time BTC liquidation data acts as a live feed of market sentiment. A flood of liquidations signals that price moves have defied what most traders bet on. When the market becomes overcrowded with over-leveraged longs or shorts, you can spot the risk of a dramatic reversal.
How to read liquidation heatmaps
Imagine if you had a map that showed you exactly where the market’s landmines were buried. That’s essentially what a liquidation heatmap is. While price charts tell you where the market has been, a heatmap gives you a sneak peek at where it might be headed next under pressure.
A heatmap turns abstract risk into a clear, color-coded picture, using a constant stream of exchange data — primarily, open interest (the total value of active futures contracts) and the leverage used. The algorithm then calculates the price point where each of these leveraged positions would be auto-liquidated.
These points on the chart cluster together in "liquidation zones" — bright red (for vulnerable long positions) or green (for vulnerable short positions) hotspots. The brighter and denser the cluster, the more fuel is piled up at that price level, waiting for a spark.
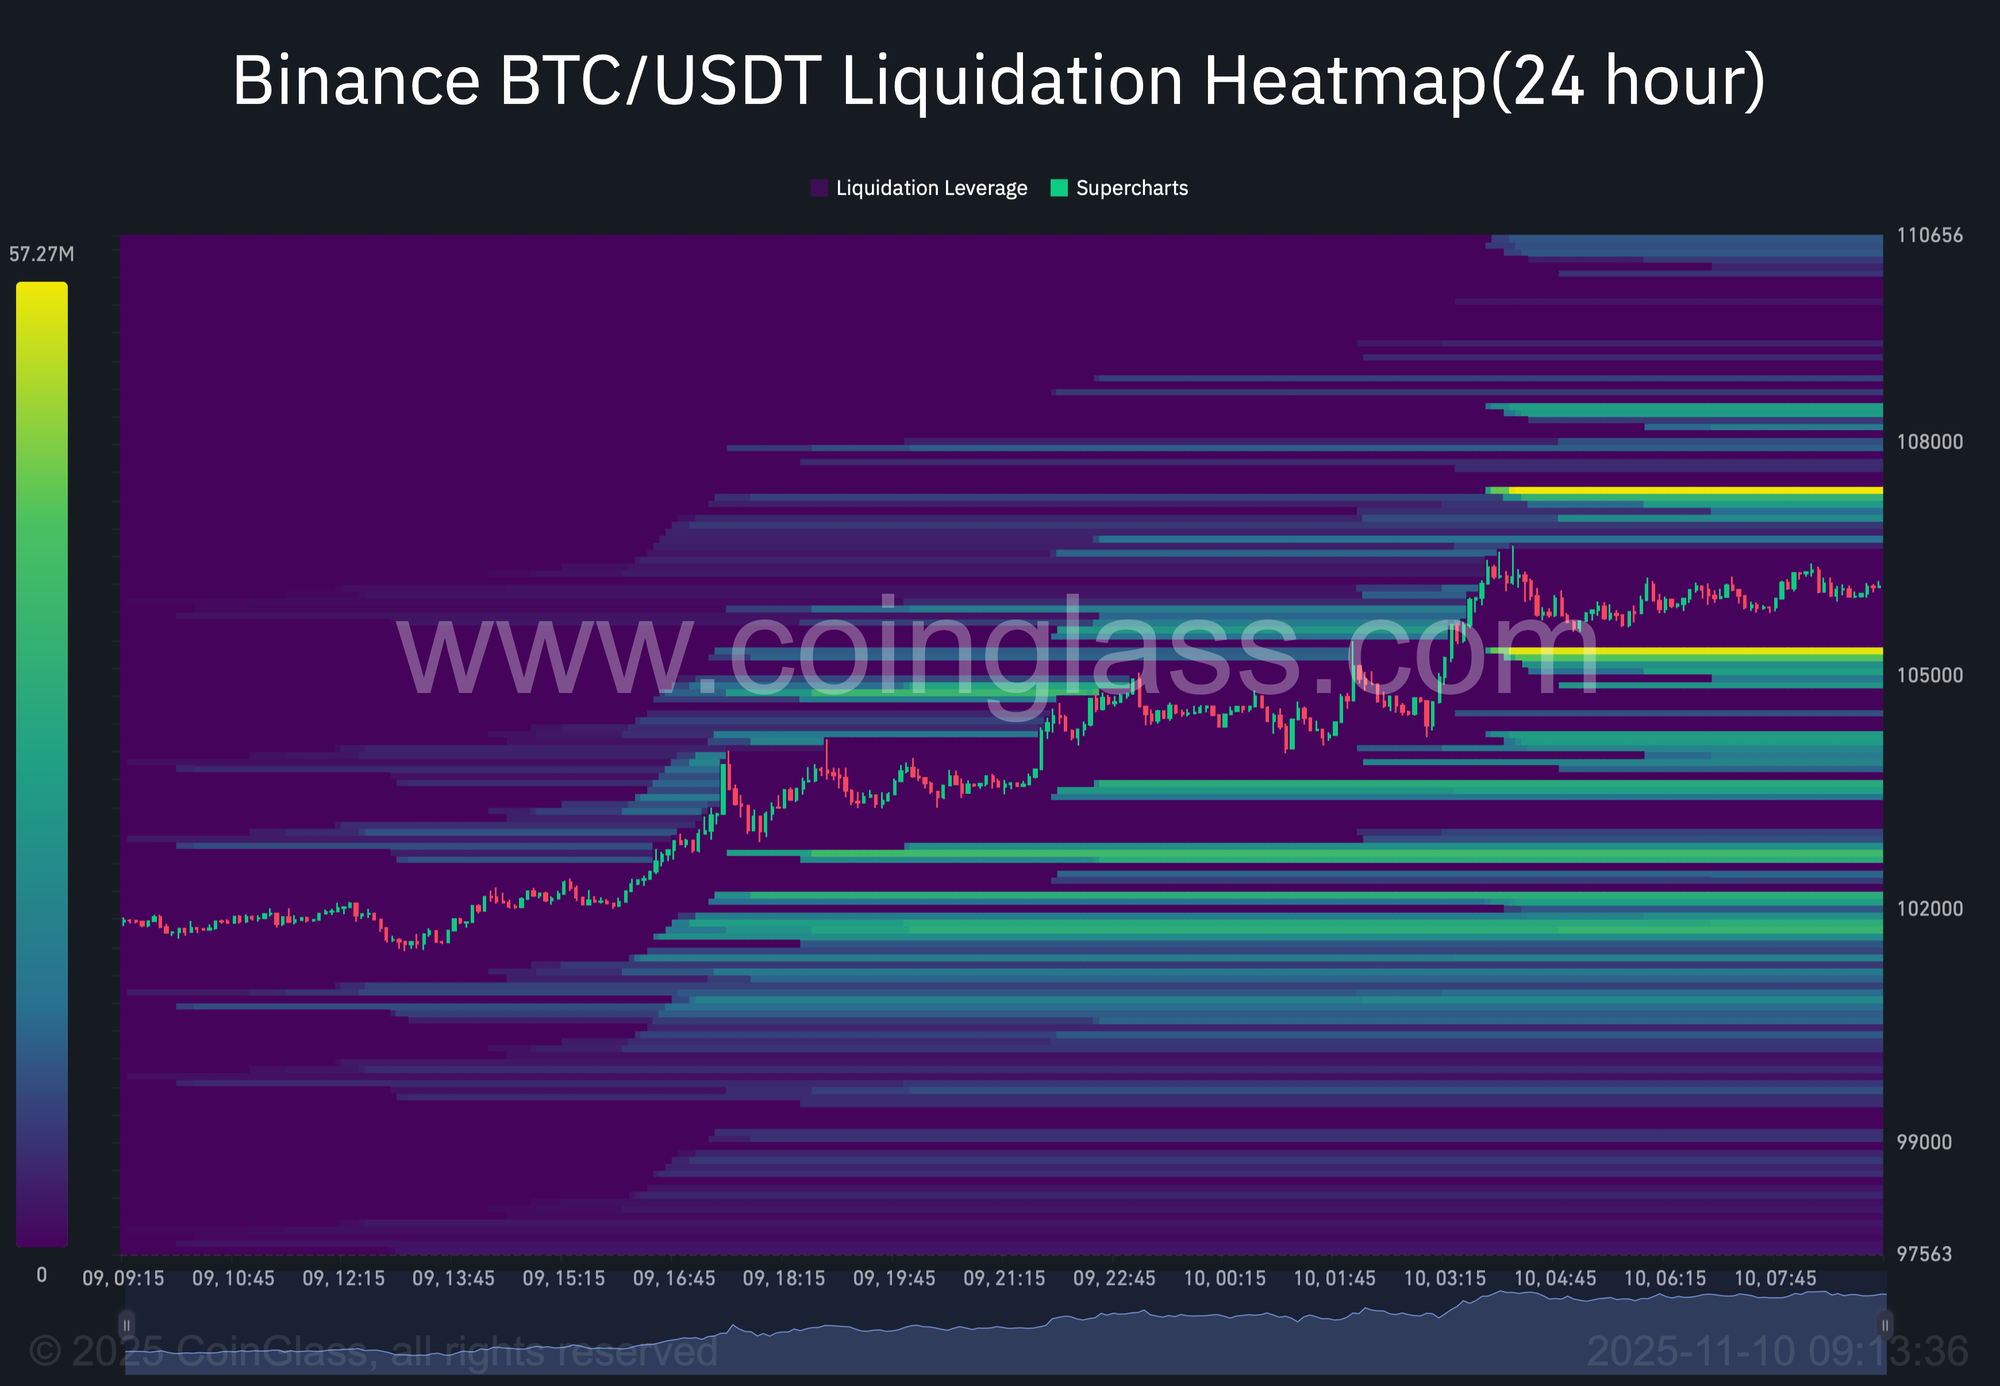
Reading one is simpler than it looks. Focus on the big, bright clusters above or below the current price.
- A massive red wall above the price? That’s a resistance zone packed with over-leveraged longs. If the price starts rallying toward it, the odds of a sharp reversal increase as those positions get liquidated and force-sold.
- A dense green cluster below is a support zone of shaky short positions. A dip toward that level could trigger a "short squeeze," forcing bears to buy back and rocket the price upward.
Your liquidations trading playbook
Keep a close eye on liquidation charts to gauge when bullish or bearish sentiment is running too hot, which often signals looming liquidity risks.
- A liquidation tally far above the average is a blinking red light — a sign the price may have overextended itself in the short term.
- Paradoxically, massive liquidations also uncover reversal opportunities. After a devastating cascade of long liquidations, the asset is likely oversold, setting the stage for a technical rebound. Similarly, a price pullback often follows a crushing short liquidation.
- Steer clear of opening high-leverage positions near “liquidation clusters” — those danger zones on an Open Interest heatmap where forced closures are poised to happen.
Look back in time: Most brutal BTC liquidations
History doesn't repeat itself, but it often rhymes, especially in crypto. Some of Bitcoin's most dramatic chapters were written by cascading liquidations. Let's revisit a couple of key moments.
#1: "Black Friday" (October 2025)
This recent meltdown was a masterclass in how a targeted attack can exploit hidden weaknesses in crypto's very infrastructure, leading to a historic cascade. A mind-boggling $19 billion in leveraged positions vanished in under 24 hours, a liquidation event nine times larger than any before it.
On the surface, the trigger seemed to be a macro shock: a surprise announcement from President Donald Trump threatening 100% tariffs on China. But the real story began hours earlier.
One whale had already positioned themselves for chaos. They opened massive short positions and then, crucially, exploited a critical flaw in Binance's system. The exchange was pricing its collateral using its own internal market data.

The attackers pounced, dumping $90 million of a stablecoin (USDe) on Binance alone, causing its price to implode to $0.65. This instantly vaporized the collateral for thousands of over-leveraged traders, triggering a domino effect of forced selling.
The timing was diabolical. As this engineered collapse began, Trump's tariff news hit the wires, pouring gasoline on the fire. The whale calmly closed their shorts, pocketing an estimated $192 million in profit, while the rest of the market was blindsided.
The liquidation engine went into overdrive, and a critical failure emerged: liquidity vanished. Bids on the order book disappeared, and automated systems froze, trapping traders as the liquidation hammer continued to fall relentlessly.
#2 "5·19" massacre (May 2021)
In May 2021, the market was electric, with Bitcoin flying high near $42,000. The air was thick with greed, but the floor suddenly gave way.
In a brutal 24-hour period around May 19 — a date now infamous as "5·19"—BTC shed over 30%, tumbling below $30,000. The catalyst was a perfect storm of factors: as Elon Musk walked back Tesla's commitment to accept BTC as payment, and China imposed a crackdown on crypto use in the country.
Over $4 billion in crypto positions were wiped out, the vast majority being bullish long positions. This event was a devastating demonstration of how overheated speculation can trigger a liquidation cascade.
#3 Institutional unraveling (June 2022)
If "5·19" was a sudden heart attack, the mid-2022 crash was a prolonged and systemic illness. The collapse of the Terra-LUNA ecosystem sent shockwaves through the entire crypto industry, exposing the deep interconnectedness — and fragility — of major players like the hedge fund Three Arrows Capital (3AC).
As these giants buckled, Bitcoin shattered the critical $20,000 support level that many saw as a bedrock. The liquidations here were different. Instead of one violent, single-day explosion, it was a slow, grinding bleed-out. The relentless long liquidations pushed the market ever deeper into its bear market lows.
Wrapping up
Ultimately, understanding liquidations is about learning to read the market's underlying emotional state. These events are the direct result of collective greed and fear, translated into hard data. By monitoring liquidations and their tell-tale clusters on a heatmap, you shift from simply watching price action to anticipating the pressure points that can trigger it.
So, the next time you see a headline about billions being liquidated, you'll see the story behind the number. You'll recognize the cascade, identify the squeeze, and understand the market's necessary, if brutal, process of resetting excess. In the high-stakes game of crypto trading, this knowledge is your essential armor.