ETF flows vs. Bitcoin price: What the numbers actually tell us

Since their approval in 2024, US spot Bitcoin ETFs have fundamentally reshaped the asset’s market structure. For the first time, large-scale institutional capital gained regulated, direct exposure to crypto without operational custody risk.
The question is no longer whether ETFs matter — they do. The more nuanced question is how they matter. Are those capital flows the main price driver, or simply a reflection of broader market conditions?
Here we dive into the complex relationship between BTC price and ETF dynamics.
TL;DR
- Spot Bitcoin ETFs reshaped market structure, but they don’t drive daily price moves.
- Sustained inflows can tighten supply, especially when ETF demand exceeds new issuance.
- Price and flows don’t always align — institutions accumulate strategically and trim into strength.
- Lower fees attract assets; higher fees have driven persistent outflows.
- ETF flows signal medium-term positioning, not short-term trades.
What are ETF inflows and outflows?
A crypto ETF is an exchange-traded fund that invests in cryptocurrencies such as Bitcoin or ether, allowing investors to gain exposure without directly buying, holding, or managing those underlying assets. With ETFs, getting involved in crypto became as mainstream as buying stocks or precious metals.
In January 2024, the US Securities and Exchange Commission greenlit the launch of exchange-traded funds (ETFs) tracking the spot price of Bitcoin. That path had been long — the Winklevoss brothers’ first US Bitcoin ETF attempt came in 2013.
Eleven products premiered at once, promising to unlock institutional capital and forever change the crypto market. And that's exactly what they did, pulling in billions in the process. US spot Ethereum ETFs followed soon; Solana ETFs came in late 2025.
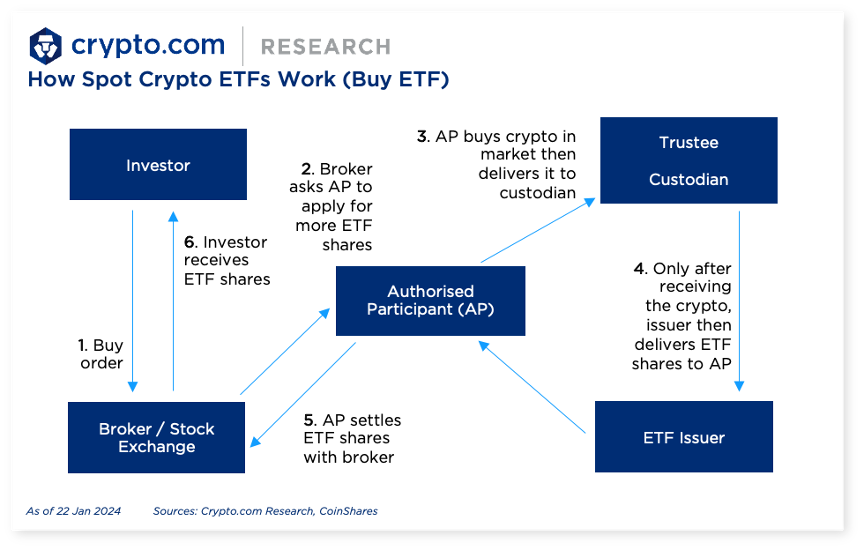
Over the lifetime of an ETF, capital rotates into it (inflows) and exits (outflows). These changes reflect the fund's strength and popularity versus rivals with similar investment goals.
Citigroup views BTC ETFs as a real-time barometer of market confidence. Yet while the rise or fall of cash being deployed may affect the underlying asset, ETF flows aren't a day trading tool. Rather, they offer a medium-term signal.
In TradFi, ETF flows often have limited immediate price impact. Bitcoin is structurally different due to supply constraints:
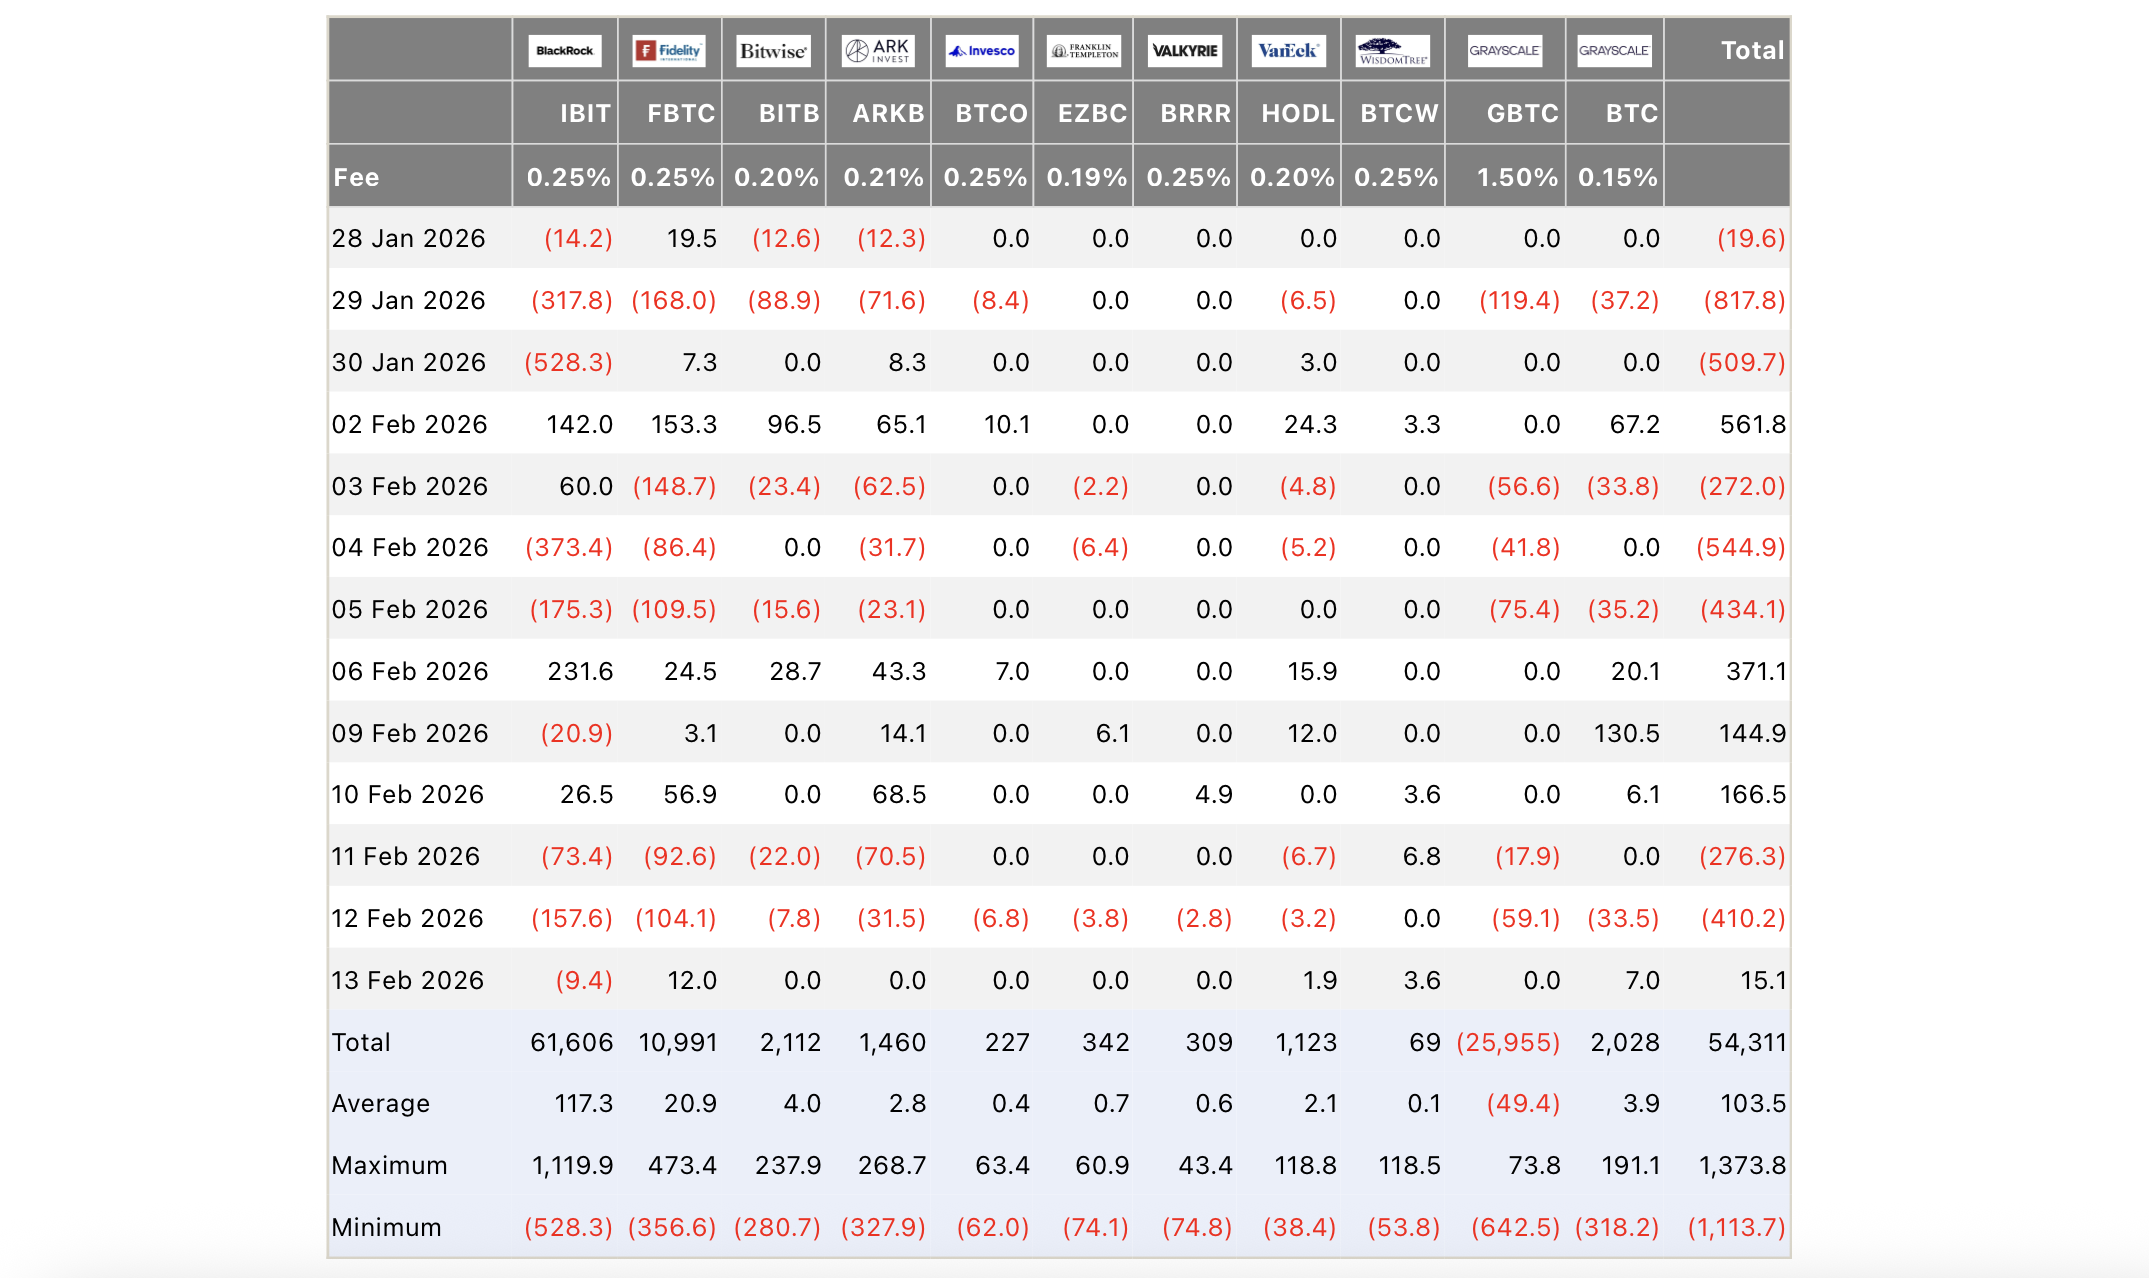
- In January 2025, ETFs added over 38k BTC as it rallied, while heavy February redemptions hurt momentum. At peak accumulation periods, spot ETF purchases have represented a meaningful share of newly issued BTC supply.
- With approximately 450 BTC mined per day since the April 2024 halving (≈13,500 per month), monthly ETF inflows exceeding 30k BTC effectively absorb more than twice the rate of new issuance. That's why sustained inflow streaks can amplify directional moves.
Three largest Bitcoin ETFs
As of February 16, 2026, the top three spot products with the largest amount of assets under management (AUM) are:
- BlackRock's iShares Bitcoin Trust (IBIT) holding 761,801.7 BTC (AUM $57.96 billion)
- Fidelity's Fidelity Wise Origin Bitcoin Fund (FBTC) holding 189,011.4 BTC (AUM $14.17 billion)
- Grayscale Bitcoin Trust (GBTC) holding 156,719.0 BTC (AUM $12.7 billion)

Not all Bitcoin ETFs trade in sync
Technically, the GBTC fund is the oldest — it was initially launched as a publicly traded, classic mutual fund in 2015. In October 2021, Grayscale filed the paperwork to convert it into an ETF, which happened two years later.
BlackRock launched its iShares Bitcoin Trust on the market once the SEC signed off on January 11, 2024. Unlike GBTC, boasting $28.6 billion in AUM by the official ETF rollout, IBIT started from zero.
You might think GBTC would have a head start, but it began to bleed immediately after launch. Meanwhile, IBIT grew by leaps and bounds, closely following the BTC price, as shown in this chart:
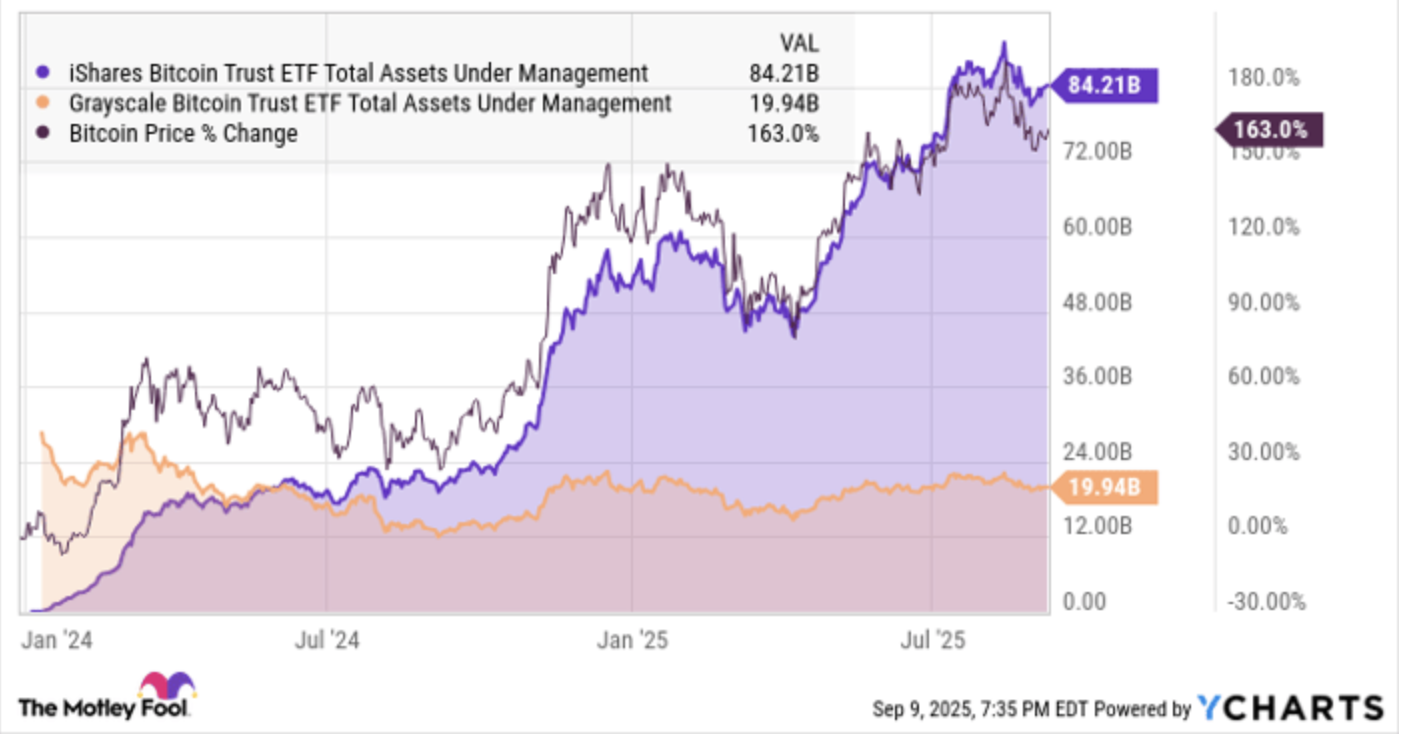
Logically, Bitcoin's ups and downs inspire bullish or bearish long-term expectations, respectively, so the ETFs should move in sync. However, while the sentiment bond is undeniable, it is not a perfect one-to-one correlation.
- IBIT's AUM typically rises as BTC appreciates and shrinks when the pioneering coin is trending down.
- For GBTC, the mathematical closeness is less obvious, as investors have plenty of alternatives with lower fees.
- Both funds showed very similar market performance, but their AUMs diverged dramatically.
Why fees drive outflows
IBIT has an annual expense ratio of 0.25%, which was also waived in the first few months as a promotional move. Grayscale, however, asks 1.5% per annum.
You might think one percentage point wouldn't matter much — that it would be minuscule. Yet for whales with a long-term view, it makes a big difference.
Example
Suppose you had $100,000 in GBTC before it converted to an ETF. Currently, Grayscale's fund management services would be costing you $1,500 a year. Migrating those funds to IBIT would save you $1,250 per year, as the annual fee would be just $250. That's the same Bitcoin exposure at a significantly lower price.
This explains why, between September 2024 and 2025, IBIT saw an 82% asset surge, while GBTC dumped by 17%.
BTC price vs. ETF flows: What is behind the divergence?
Capital flows into and out of ETFs are among the most closely watched data points for traders. However, Bitcoin's price moves do not always mirror ETF demand, leaving the crowd confused.
Spot ETFs and spot Bitcoin price do not always align for multiple reasons:
- Capital deployment strategies used by institutions
- Risk management approaches
- Confidence in Bitcoin itself, which still behaves differently from TradFi risk assets like stocks or bonds.
ETF flows are a lens into institutional behavior, as they result from deliberate allocation decisions. Reported daily, they reflect strategies pursued by asset managers, financial advisors, and hedge funds. Consider these opposite scenarios:
- Bitcoin ETF inflows create direct market demand. When capital moves into a product, its issuer is obliged to buy Bitcoin to back new shares.
- Bitcoin ETF outflows spark market selling. When investors pull funds from an ETF, the issuer sells Bitcoin, a negative driver for the price.
So, why do price and flow data diverge?
Because capital flows aren't about urgency. They describe intent. For instance, institutions tend to accumulate when the price is consolidating and sell into strength.
Furthermore, ETFs aren't the only piece of the puzzle behind short-term price direction.
What an inflow streak actually means
Suppose an ETF sees a steady influx of capital over several weeks. Such persistence reflects longer-term horizons, not tactical trading. Institutions view BTC as a part of their portfolio.
- There could be less downside risk. Capital is more committed and will likely withstand modest pullbacks.
- Supply tightens. Bitcoins held in regulated ETF custody are not typically traded or hypothecated (used as collateral for the issuer's own financial gain).
- Traders can anticipate strong directional moves once macro or liquidity conditions improve. It's about buying the dip, not chasing short-term spikes.
What an outflow streak actually means
News of persistent outflows generates anxiety, but their impact is often overblown. It's all about duration. You could dismiss a few days of outflows as noise, but multi-week bleeding during a market downturn is a red flag.
- Short-term outflows ≠ people jumping ship. Investors can move capital out of ETFs for a variety of reasons, including rebalancing, tax considerations, hedging, and profit-taking into rallies.
- Persistent outflows may be a cause for concern. If the Bitcoin price and derivatives open interest (OI) are weakening simultaneously, this could mean fading conviction and capital flight.
Be very careful when the price is going vertical but the smart money flowing into the ETF is weak or actually leaving (negative). This dynamic suggests that the explosive move is not backed by fresh institutional capital — a potential sign of distribution rather than a healthy trend continuation.
Factor in derivatives
Crypto derivatives — futures and options — also matter because institutions use them to hedge ETF exposure. To make a more accurate read, pair ETF flow data with the dynamics of futures funding rates.
- Rising ETF inflows + neutral/slightly negative funding rates = spot-driven accumulation. Healthier for an upside.
- Rising ETF inflows + aggressive long positioning + higher funding rates = crowded upside, the price may stall.
The bigger picture
Bitcoin ETFs have not eliminated volatility, nor have they transformed Bitcoin into a traditional macro asset. What they have done is introduce a slower, more methodical layer of capital that operates on allocation cycles rather than speculation cycles.
ETF flows do not dictate daily price swings. Over shorter timeframes, derivatives positioning, liquidity conditions, and sentiment still dominate. But over weeks and months, sustained inflows or persistent redemptions reveal where long-term capital is positioning.
The edge lies in understanding the difference. ETF flows are a structural positioning signal, not a short-term trading trigger. Traders who interpret them in context stop reacting to noise and start identifying where conviction capital is accumulating, hedging, or quietly stepping aside.