Overview of crypto charting tools

Crypto trading charts are the bedrock of technical analysis. They connect to markets, wallets, and exchanges to synchronize data in a single secured account. Users can explore digital assets, trade them, test strategies, and manage risk — all in one place. Here is the lowdown on crypto charting tools for major trading platforms in 2024.
What is a crypto charting platform?
Charts represent market data — such as price and volume — in a 2D format. The best crypto trading tools not only generate graphs but let you draw over them and combine indicators for in-depth analysis. Such software, indispensable for trading crypto, resembles platforms for stocks, commodities, and other assets.
Prices and volume in the cryptocurrency market do not foretell its direction. Technical analysis is more complex as it seeks out patterns that hint at bullish or bearish moves. Informed decisions require trend lines, price levels, and other visual aids. The best crypto charting tools are all-encompassing dashboards connected to various exchanges and suited for different strategies, from scalping to event-driven trading.

Technical analysis fundamentals
Chart reading skills are essential for any crypto trader. They form the pillars of technical analysis — price assessment and pattern recognition. The best cryptocurrency charting software delivers a mix of market-driven information that can underpin any strategy. Discover the core data points below.
Key parts of crypto charts
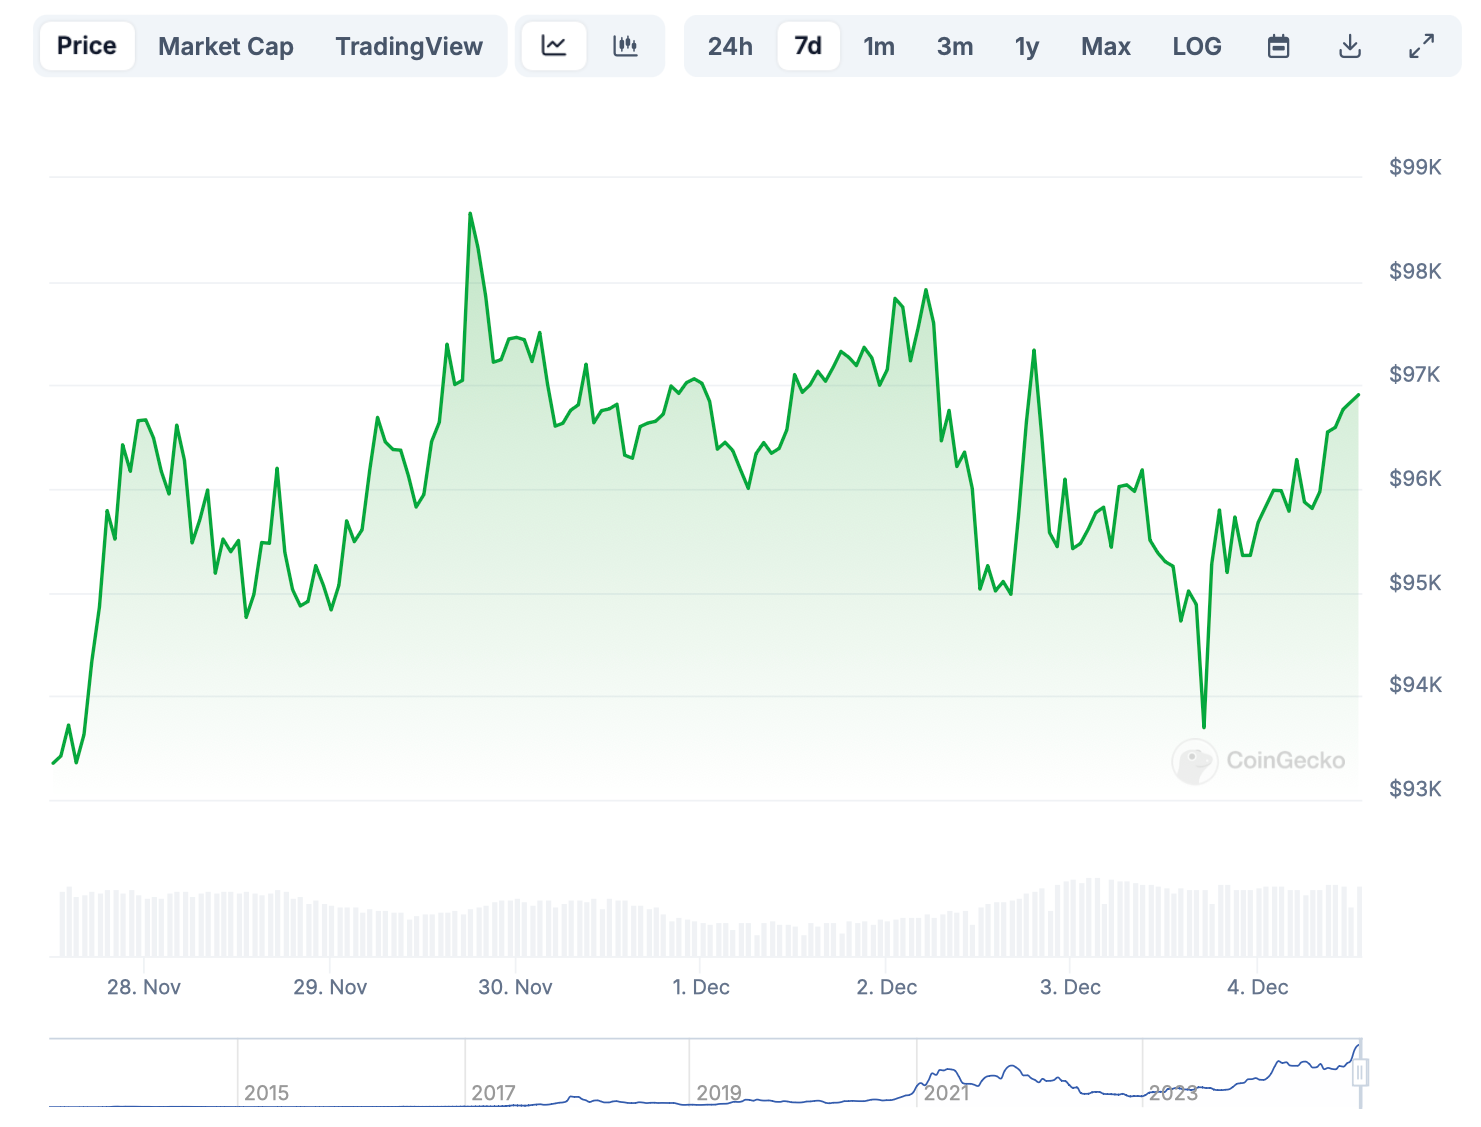
The most basic representation is a real-time chart for a trading pair. By default, cryptoassets are paired with the USD, with a range of alternative quote currencies. For instance, Coingecko gives a choice between fiat and cryptocurrencies on three versions of the chart:
Price chart — a linear or logarithmic graph showing price dynamics for a specific asset over a chosen period.
Market cap — a linear or logarithmic graph reflecting market capitalization dynamics for a specific asset over a chosen period.
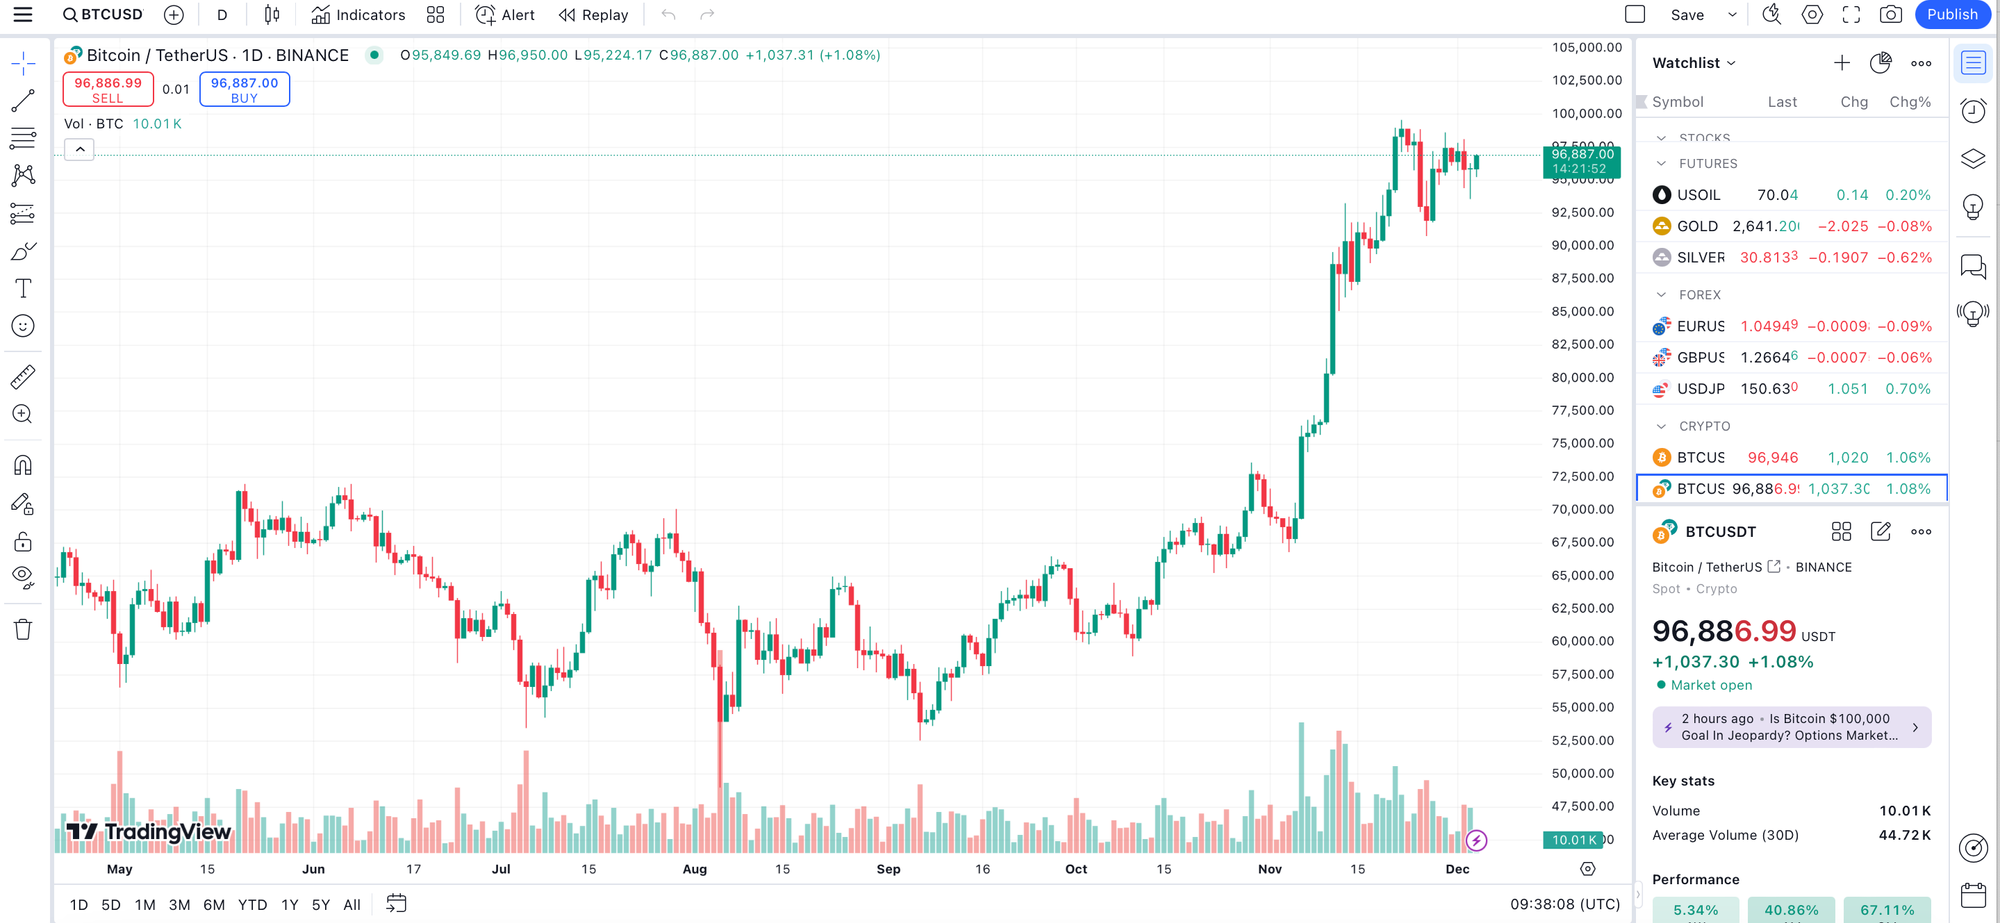
TradingView — an advanced, candlestick version of the price chart.
The standard price chart — a line graph — shows key data points informing trading indicators. The TradingView integration offers data from a leading platform used by 90+ million traders and investors. Before looking at professional crypto charting tools, let's zoom in on the basics.

Trading pair. The chart above reflects changes in the Bitcoin price against the US dollar (BTC/USD). Any trading pair is expressed as base currency/quote (counter) currency.
Current Price. This is the dominant price for BTC in buy and sell transactions.
Period. The chart can show changes over different time increments: the past 24 hours, 7 days, 14 days, 30 days, 90 days, 180 days, and max (all-time). You can use the date fields to set any other period.
High/Low. The accompanying table features the highest and the lowest prices over the past 24 hours, 7 days, and all time. These indicators are constantly changing due to price volatility.
Trading volume. The height of the bars along the horizontal axis changes proportionately to the trading volume. They grow or shrink as the price changes.
Candlesticks on crypto trading tools
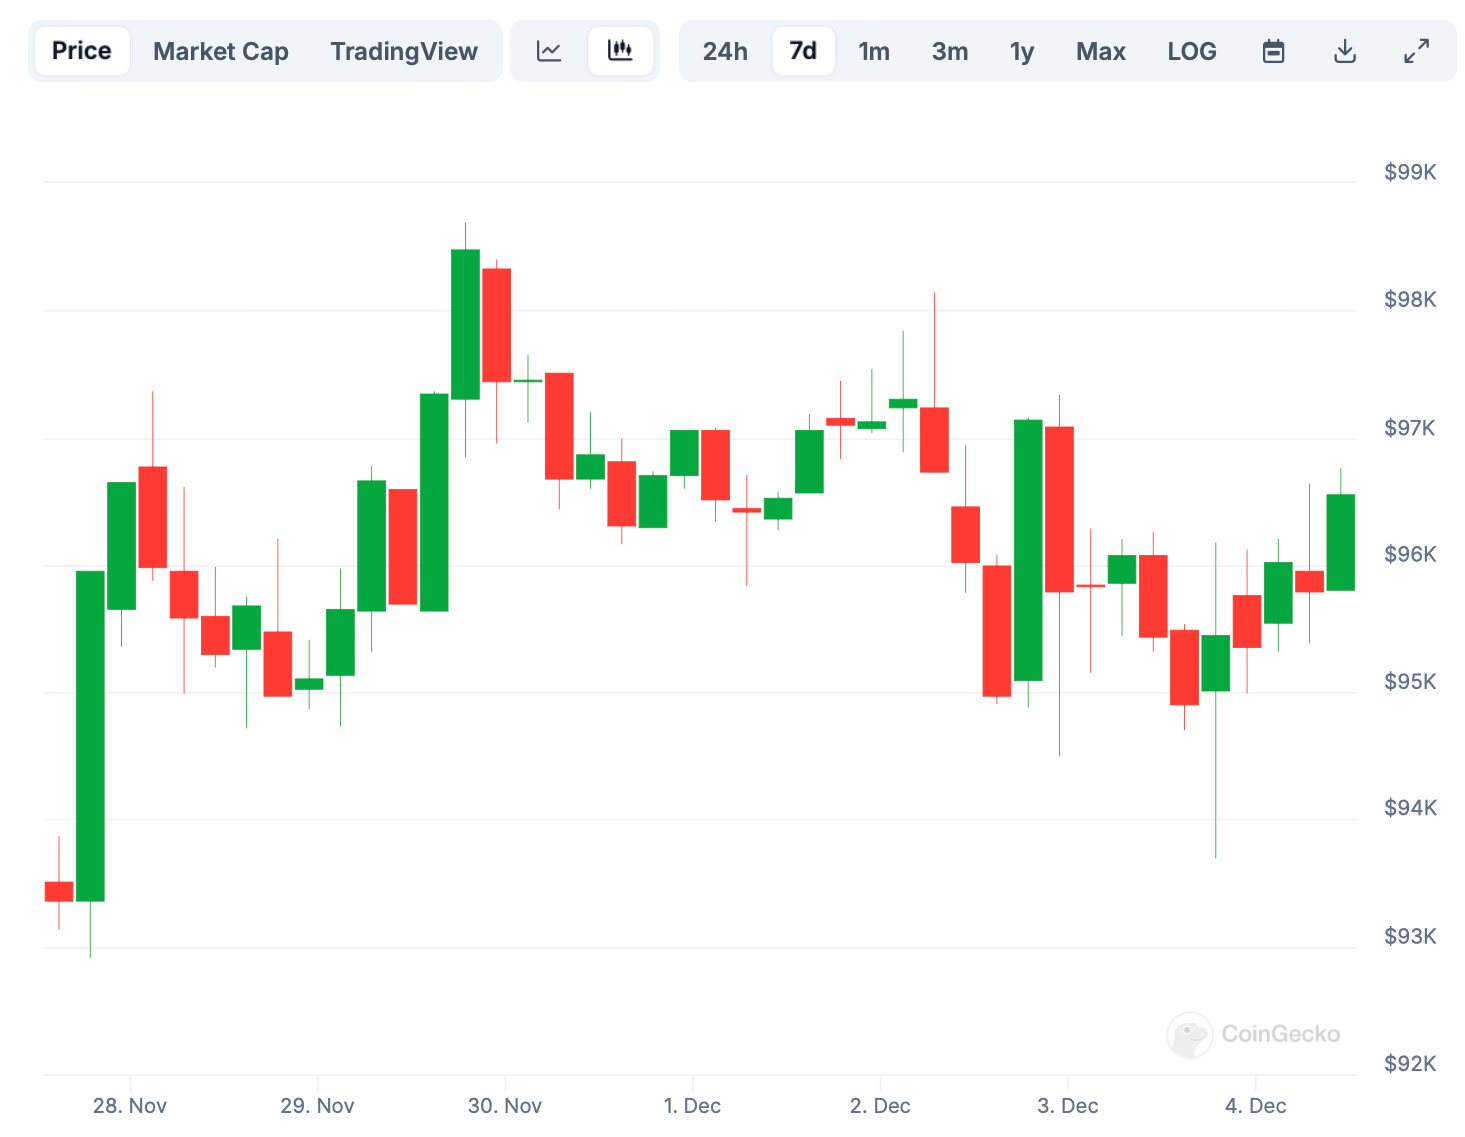
This second version of Coingecko's price chart is more informative as it uses candles instead of lines. Each candle represents four data points: open, close, high, and low. It has two elements:
- body (the thick part connecting the opening and closing prices)
- wicks, or shadows (the thin parts extending to the highest and lowest price points)
Reading candles is crucial for any trading strategy. Their color shows the prevailing price direction within the chosen time unit — for example, every hour. Some charts support customized colors, but the default setting is always green and red. Green candles are bullish — they show price increases. Red candles reflect bearish moves or price declines.

How to read a crypto chart
Traders use a range of chart-based indicators to assess the prospects of cryptocurrencies. These patterns are mainly based on price and volume and involve specific positions of candles. Advanced combinations require sophisticated metrics and trend lines.
Basic patterns for cryptocurrency traders
Crypto investors use patterns familiar to stock traders and foreign exchange analysts. Their most basic categorization concerns direction.
Bullish patterns are interpreted as a sign of a future rise, prompting traders to buy the cryptoasset in question.
Bearish patterns indicate the opposite, so traders may sell before the downturn deepens. Some of them buy the dip instead, expecting the trend to reverse.
Head and shoulders
In head and shoulders, the price peaks and falls to the base of the previous upward move. One of the most reliable signs of reversal, it usually appears when an uptrend loses steam.
The pattern comprises three peaks, where the one in the middle is the highest — the "head." The line drawn at the two troughs is called the neckline. The inverse pattern — inverted head and shoulders — includes three dips instead of peaks, a potential harbinger of a bullish-to-bearish reversal.
Shooting Star
This pattern includes a short body near the day's low with a long wick faced upward. As a sign of a possible downturn, the shooting star may appear before the sellers take over. The next candle defines traders' behavior — they may sell if it indicates a decline.
Inverted Hammer Candlestick
This pattern looks like an upside-down shooting star where the upper wick is at least twice as long as the body. An inverted hammer after a downtrend shows that reversal is possible — the price hesitates to fall deeper. If the low and the open are the same, this sign is unequivocally bullish, and the candle is green.
Wedge
A wedge is an incomplete triangle formed by trend lines converging from left to right. One of them connects the highs of price movement over the chosen period; the other one is drawn through its highs. Generally, wedges are fairly reliable reversal predictors.
Volume declines as the price progresses through the wedge. The pattern also includes a breakout from one of the trend lines — typically, it occurs in the opposite direction. Depending on the configuration, wedges can be bullish or bearish.
A rising wedge hints at a likely decline following a breakout of the lower line. Traders can therefore sell the cryptocurrency in question. A falling wedge points to a possible rise after a breakout of the upper line, prompting buy orders.
Possibilities vs. predictions
Charts, indicators, and reading techniques can help you understand the crypto market, but technical analysis does not have guaranteed outcomes. There are no foolproof ways to predict where your asset will go. Hence, every trader should research the many facets of crypto management, including fundamental analysis.
This approach focuses on factors driving prices through supply and demand — aspects like adoption, trading, transaction activity, and hash rate. For example, BTC's surge in the second half of 2020 was attributed to its adoption by eBay and PayPal. In January 2024, it surged following the launch of spot Bitcoin ETFs in the US.
Free cryptocurrency charts vs. subscriptions
Few crypto charting platforms are free, but most paid products have demos. As novices learn the ropes, they can experiment with free tools before tackling the full range of features. For experienced users, advanced trade analytics and the best crypto charts are well worth the money.
Paid tools have superior functionality. They provide unlimited advanced charts, more technical analysis tools, risk management settings, and other premium features. Free charts have imperfections expert traders cannot afford to overlook, such as:
- Price reporting delays
- Lack of volume data
- Fewer technical indicators
The first two flaws are not very common, but the latter is ubiquitous and the most impactful. Free charting tools may only let you use a couple of technical indicators at a time. Furthermore, saving existing charts or using more than one chart for a trading pair may be impossible.
Popular crypto charting software: TradingView
Opinions about the best crypto charting software vary, but popular platforms suit most trading strategies. Their users buy and sell digital currencies using exchange accounts, as the software connects to major exchanges and multiple crypto markets.
TradingView is a common choice for crypto investments as it is intuitive, flexible, and all-inclusive. Its functionality extends beyond crypto analysis tools.
- Apart from crypto coins, one can monitor equities, commodities, and precious metals. For example, users can trace the performance of companies exposed to crypto, such as AMD or Nvidia.
- An easy-to-use interface and in-depth educational wiki make it suitable for rookies.
- As one of the oldest platforms (established in 2012), TradingView boasts a large and buzzing community where trading ideas and custom-made indicators are shared.
- The social aspect is pronounced — this digital environment features profiles, chat rooms, followers, and comments.
- Users can build and share their own custom indicators in the Pine scripting language. There is a vast charting tool collection tailored to Bitcoin and other cryptocurrencies.

The free version features three simultaneous indicators, 12 charts, and 50+ drawing tools. There are also several ad-free subscription models with broader functionality. For example, the Pro premium account allows five indicators per chart and two charts per window with real-time data, customizable time intervals, and alerts.
Bots for trading software: Pros and cons
To save time and effort, some crypto investors resort to algorithms. Trading bots are pieces of software designed to analyze the crypto space — price, volume, time, and other criteria — and place orders on the owner's behalf. Such automated strategies combine technical analysis with algorithmic trading, which can continue 24/7.
Yet bots are not infallible, so they should not be left to their own devices. Even the most refined piece of software can generate losses unless it is monitored and maintained. Therefore, a positive track record in terms of performance and security is crucial.
Beyond cryptocurrency charting software
Cryptocurrency trading is inconceivable without powerful charting tools. They support in-depth analysis, manual and algorithmic trading, portfolio management, and risk control. Users can develop their own trading strategies for crypto assets and share customized tools with peers.
However, software for the crypto industry is not limited to graphs — the best charting tools exist alongside platforms for crypto taxes, portfolio tracking apps, calendar tools, and other aids. The industry is developing at breakneck speed, and so are the aids for crypto holders.


