What drives Bitcoin’s price? The forces inside the market

Our first article in this series covered forces that act on Bitcoin from outside: global liquidity, interest rates, ETF flows, and institutional demand (read part one). This one looks inside the market, from leverage and the supply schedule to who holds the coins and how thin the order books get when something goes wrong.
TL;DR
- Scarcity alone doesn’t set the price. Bitcoin's supply cap at 21 million coins matters most when demand accelerates.
- Long-term holders control most of the float, so their behavior matters more than any single headline.
- A “whale is selling” headline means little without knowing who sold, how, and who bought.
- Order-book depth decides how much money it takes to move the price, and it thins out on weekends and in panics.
- Leverage amplifies moves in both directions, and liquidation cascades can push the price far beyond what any news justifies.
- No factor leads permanently. Which one dominates depends on the moment and the time horizon.
Bitcoin’s supply: Scarcity matters, but not in isolation
Bitcoin has a fixed maximum supply of 21 million coins, with roughly 20.097 million in circulation as of mid-October 2026, per CoinGecko. Halving events cut issuance in half every 210,000 blocks (roughly every four years), which reduces new daily supply. Millions of coins are also permanently lost or sitting in long-dormant wallets, which shrinks the liquid supply further. In early 2025, Chainalysis put the permanently lost figure at 2.3-3.7 million BTC.
This fixed supply is why Bitcoin is seen more as a digital store of value, or “digital gold,” than as a flexible everyday currency. But the cap provides hard scarcity and halvings shift the supply-demand balance without automatically creating higher valuations. The actual price depends on a broader mix of network security, macro conditions, utility, and continuing institutional adoption and capital flows.
Restricted supply matters most when demand accelerates, whether from institutional inflows, ETF accumulation, or macro shifts. Buyers then have to bid aggressively to coax long-term holders into selling, and the thinner the exchange depth, the faster the upswings.
Available supply ≠ exchange balances
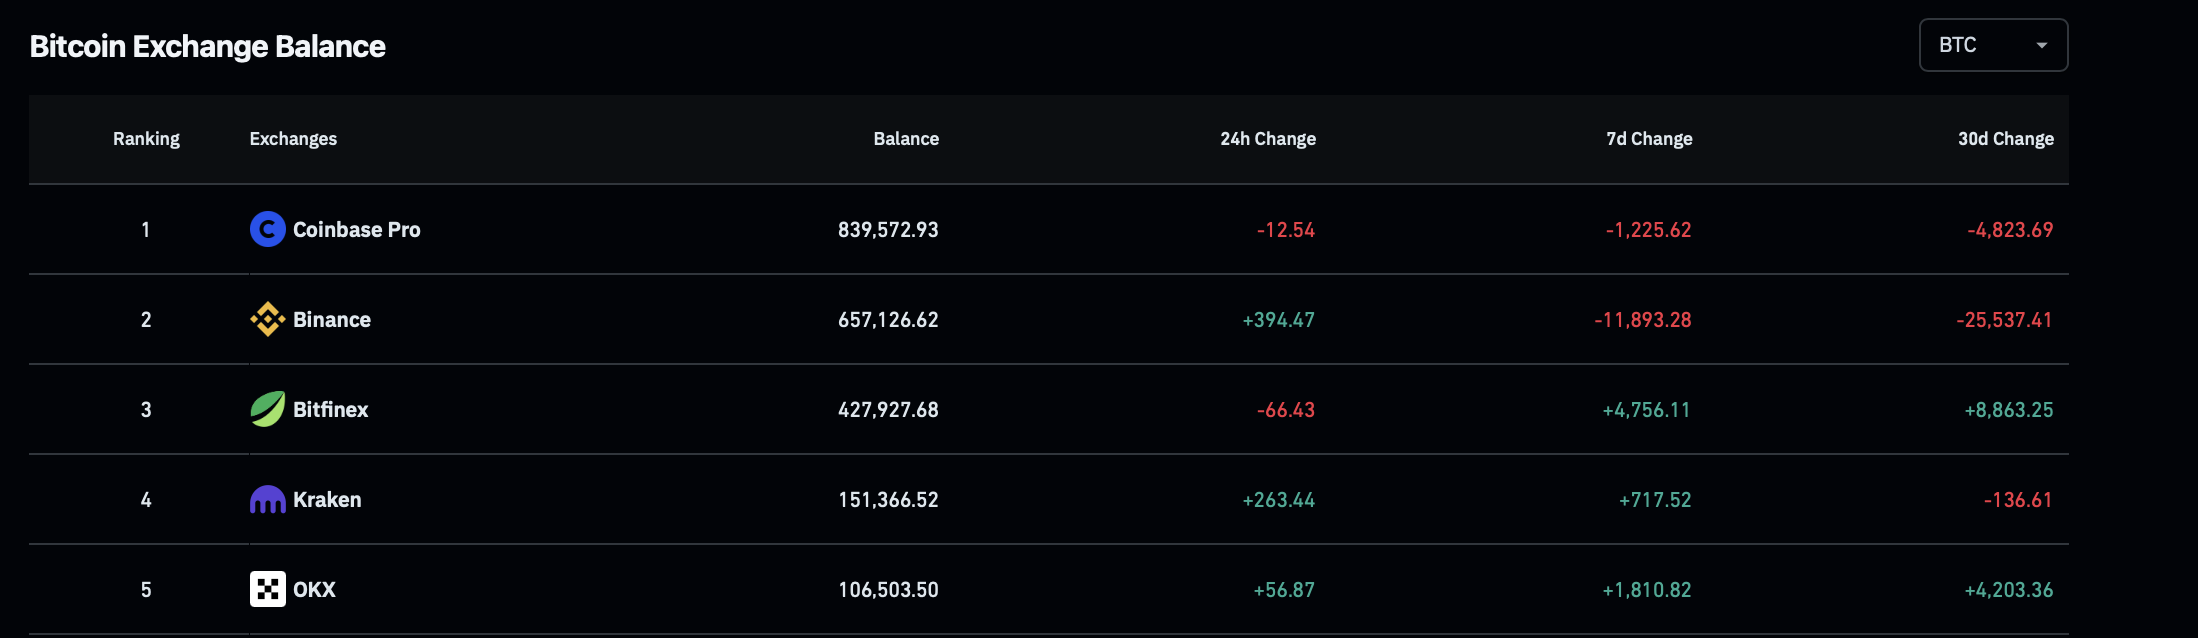
Declining exchange balances generally imply accumulation, but they’re an imperfect measure of available supply. Coins also move through over-the-counter (OTC) deals, wrapped assets like WBTC and derivatives, and institutional custody transfers. Large entities use private vaults that bypass exchange metrics entirely.
Long-term holders: Hidden supply variable
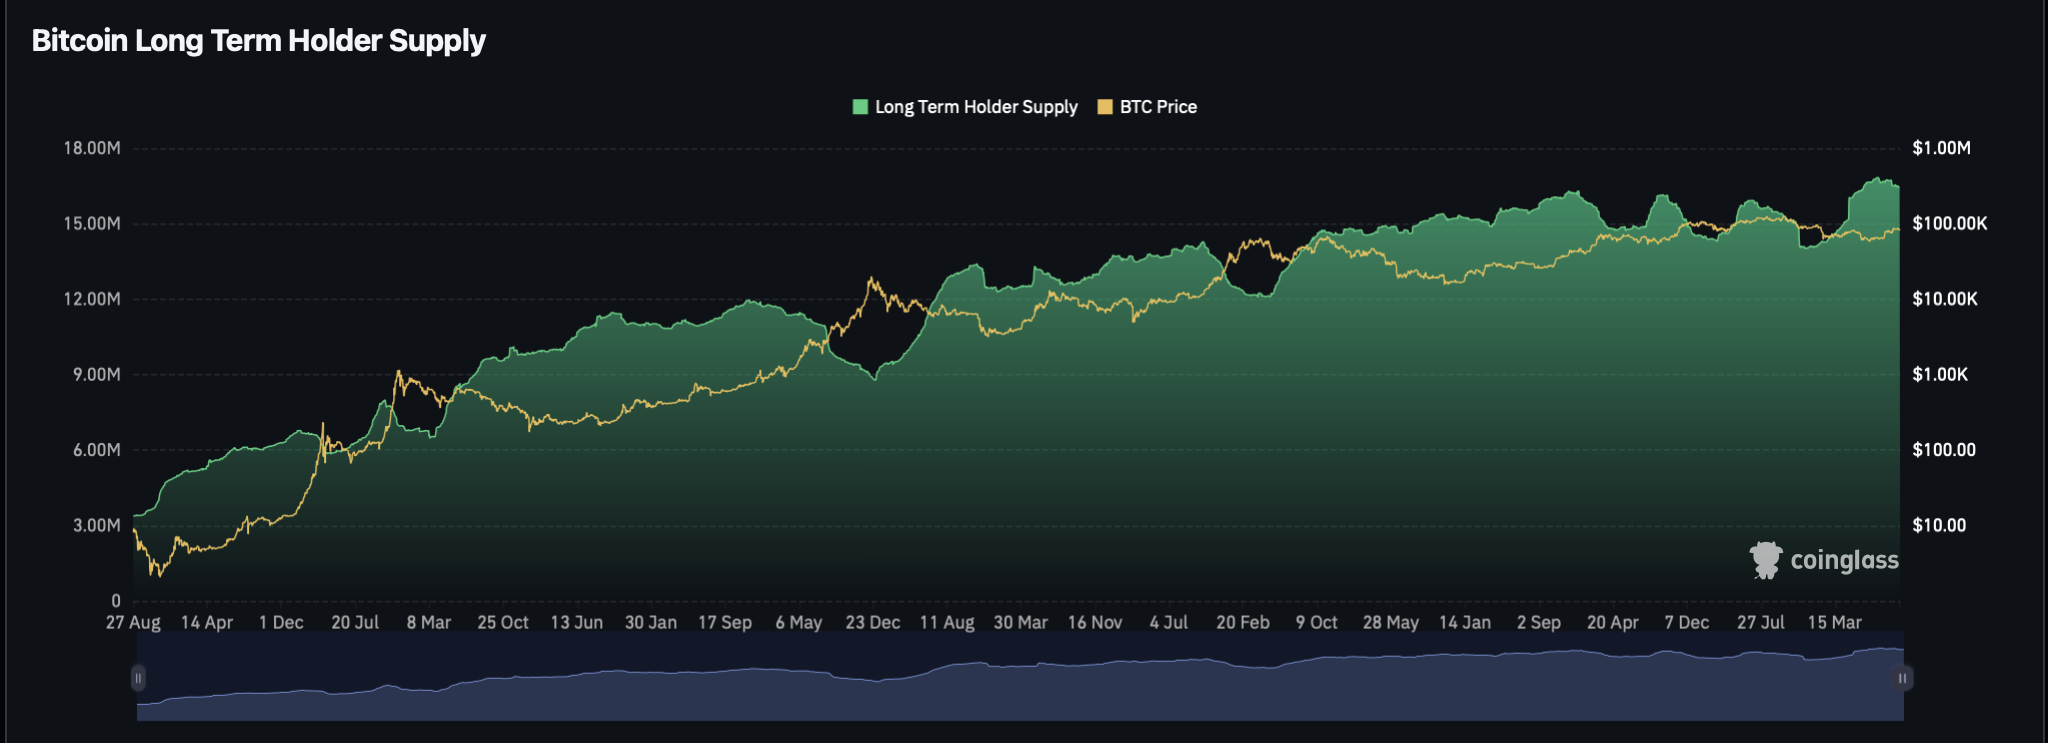
Long-term holders (LTHs) are generally defined as addresses holding bitcoin for 155 days or longer. This cohort holds most of the supply. Glassnode’s October 10 2026 snapshot counts about 16.4 million BTC in its hands, over 80% of circulating coins.
When LTHs move coins into cold storage, they tighten the liquid float. Fewer coins are available to meet new demand, so the market becomes more sensitive to demand shocks. This accumulation phase tends to accelerate in bear markets and long consolidations, and it tends to support prices.
The opposite, the distribution phase, works as a release valve. In the parabolic rallies of late-stage bull markets, LTHs gradually take profits and pass their “old money” coins to short-term holders (STHs) and to new retail and institutional buyers.
Whales: Why a “whale is selling” headline is often noise
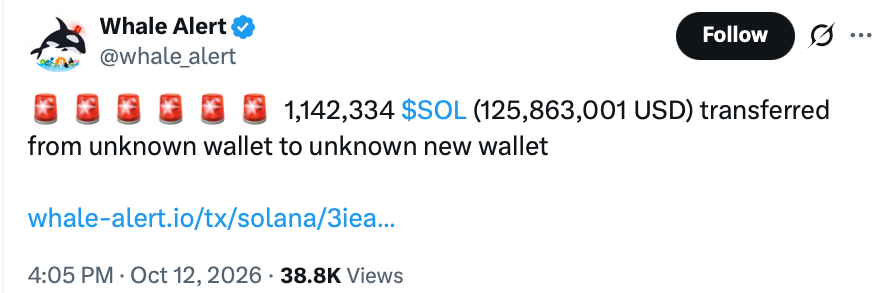
Not every whale sale signals a loss of confidence. A sale is bearish only if the market can’t absorb it, and whales sell for reasons that have little to do with conviction:
- Over-leveraged whales forced to liquidate after margin calls
- Treasuries and foundations selling tokens to fund operations or ecosystem growth
- Miners selling to cover electricity and hardware costs
How the sale happens matters too. Dumping on an exchange can push the price down, while an OTC desk usually has far less immediate impact. Motivation counts as well, since a minor portfolio rebalancing and a systemic exit are very different events. So does the buyer: retail, institutions, smart whales, or market makers?
The question that matters most for the price outlook is whether ownership is concentrating or fragmenting.
- If one whale sells and 10,000 retail accounts buy, ownership is fragmenting. This is often read as bearish, since coins moved from one strong hand to many weaker ones.
- If three whales sell and an institutional custody wallet absorbs the entire block, ownership is concentrating, which is often read as bullish.
Market makers moving inventory to stay delta-neutral can also look like large transfers, but they carry no directional view.
Miners: From forced sellers to market participants
Miners are the only source of newly minted bitcoin. At press time they receive 3.125 BTC per block, which works out to roughly 450 new coins a day. Nearly everything else that trades comes from coins mined earlier and bought from existing owners.
This means miners’ influence on price is smaller than it might seem. It shows up mainly when they act as forced sellers under financial stress, or as strategic participants shaping network security and supply.
- In bull markets, many miners hold on to newly minted coins instead of selling, which reduces the supply available on the market.
- In bear markets, when the spot price falls below production and electricity costs, miners may sell at depressed prices to cover overhead, either from treasury reserves or by sending fresh coins to exchanges. That adds short-term selling pressure.
Smaller or less efficient operations may also shut down. This phase, known as miner capitulation, often coincides with local market bottoms. As machines go offline, the protocol lowers mining difficulty at its next adjustment, which makes mining more profitable for the survivors and helps set the stage for a recovery.
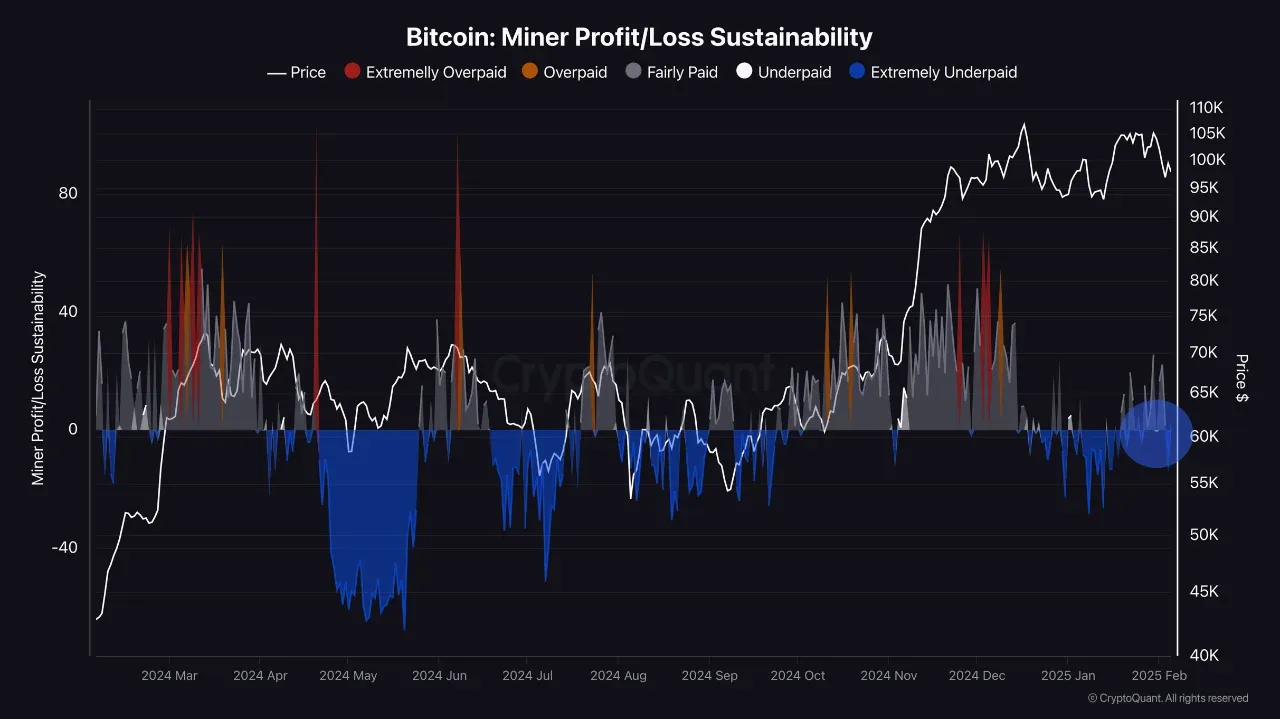
In recent years, large mining firms have also moved into high-performance computing and AI. Diversified businesses like these are less prone to immediate fire sales.
On-chain activity: What Bitcoin’s blockchain can and can’t tell you
On-chain data shows what is happening to existing coins: how much moves, where, and how long they sit still. It doesn’t always tell you why the price is moving.
Key metrics include:
- Active addresses: unique addresses sending or receiving transactions over a set window, as a gauge of network participation
- Transaction volume: total Bitcoin transferred, though bots, scripts, and internal wallet shuffles can inflate it
- Realized cap: values each coin at the price it last moved on-chain instead of the current market price, which gives a better baseline of capital actually invested
- MVRV (market value to realized value): compares market capitalization to realized capitalization to show whether the asset looks overvalued or undervalued against its cost basis
- SOPR (spent output profit ratio): shows whether coins moving on-chain are being sold at a net profit or a net loss
- Stablecoin liquidity: a broader indicator of dry powder waiting to enter the market
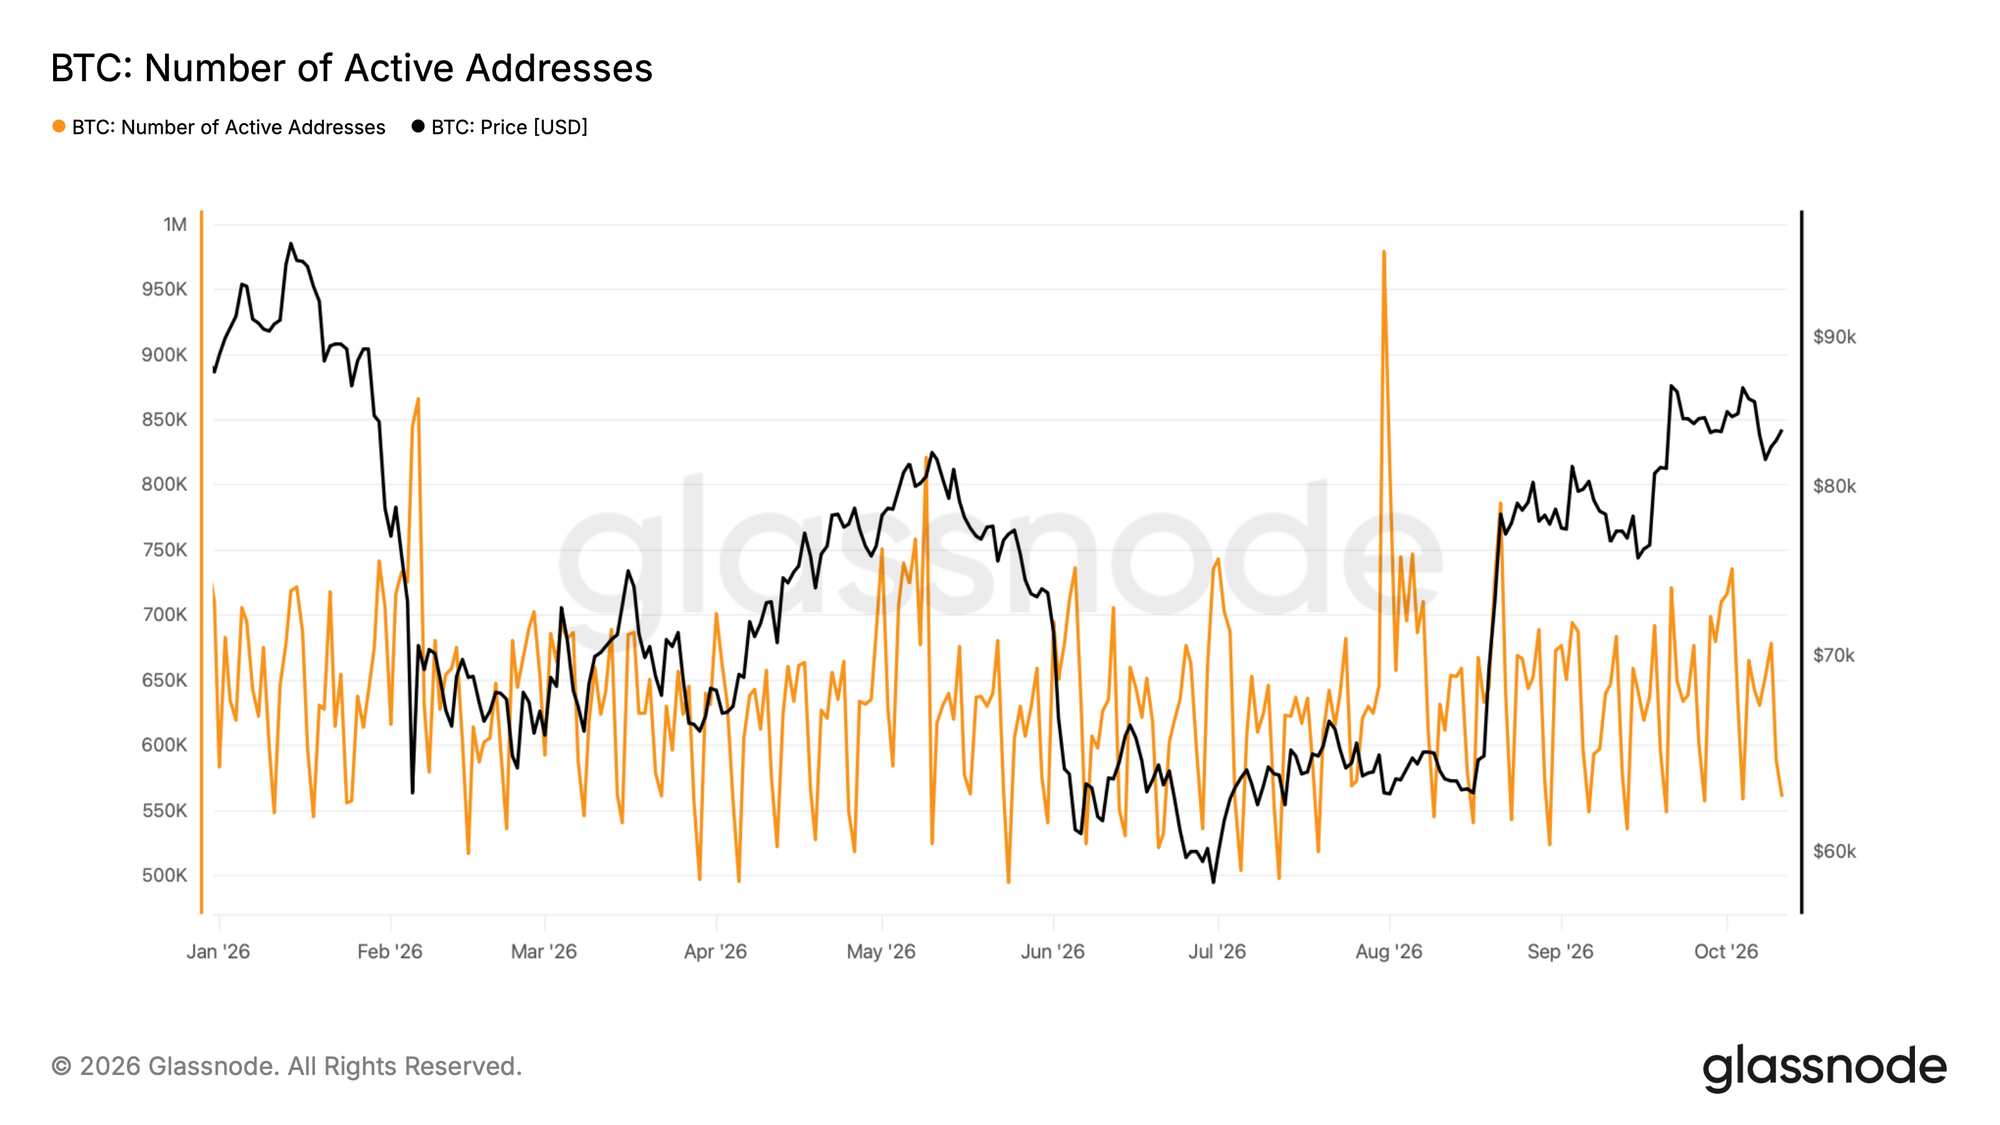
On-chain activity ≠ economic demand
On-chain readings shouldn’t be taken in isolation. One entity can control thousands of addresses, while a single exchange address can stand in for millions of users. Exchange, OTC, derivatives, and ETF trading are blind spots, and not every recorded transfer is a trade. Moving coins between your own wallets carries no intent to buy or sell, and a spike in transactions from network spam can be mistaken for organic demand.
Leverage: Why Bitcoin moves further than fundamentals suggest
Leverage lets investors borrow capital to open larger positions than their balance would normally allow. It amplifies price moves in both directions, boosting returns in a rally and accelerating losses in a downturn. The latter often ends in rapid liquidation.
Leverage is expressed as a ratio (5x, 10x, 50x) showing how much the position is multiplied relative to the initial collateral, or margin. A $1,000 investment at 10x creates a $10,000 position. If BTC rises 10%, the position gains $1,000, a 100% return on the original margin.
If BTC drops 10% instead, the loss is $1,000, which wipes out the margin. In practice the exchange steps in a little earlier. At a specific price threshold it automatically closes the position so the trader can’t lose borrowed money, and that threshold sits slightly before the full 10% drop because the exchange keeps a small maintenance margin in reserve.
Cascading liquidations can create price moves that no fundamental data explains. Bitcoin is prone to sudden, violent spikes and drops, often called long squeezes and short squeezes, that flush out leveraged positions before the price resumes its broader trend.
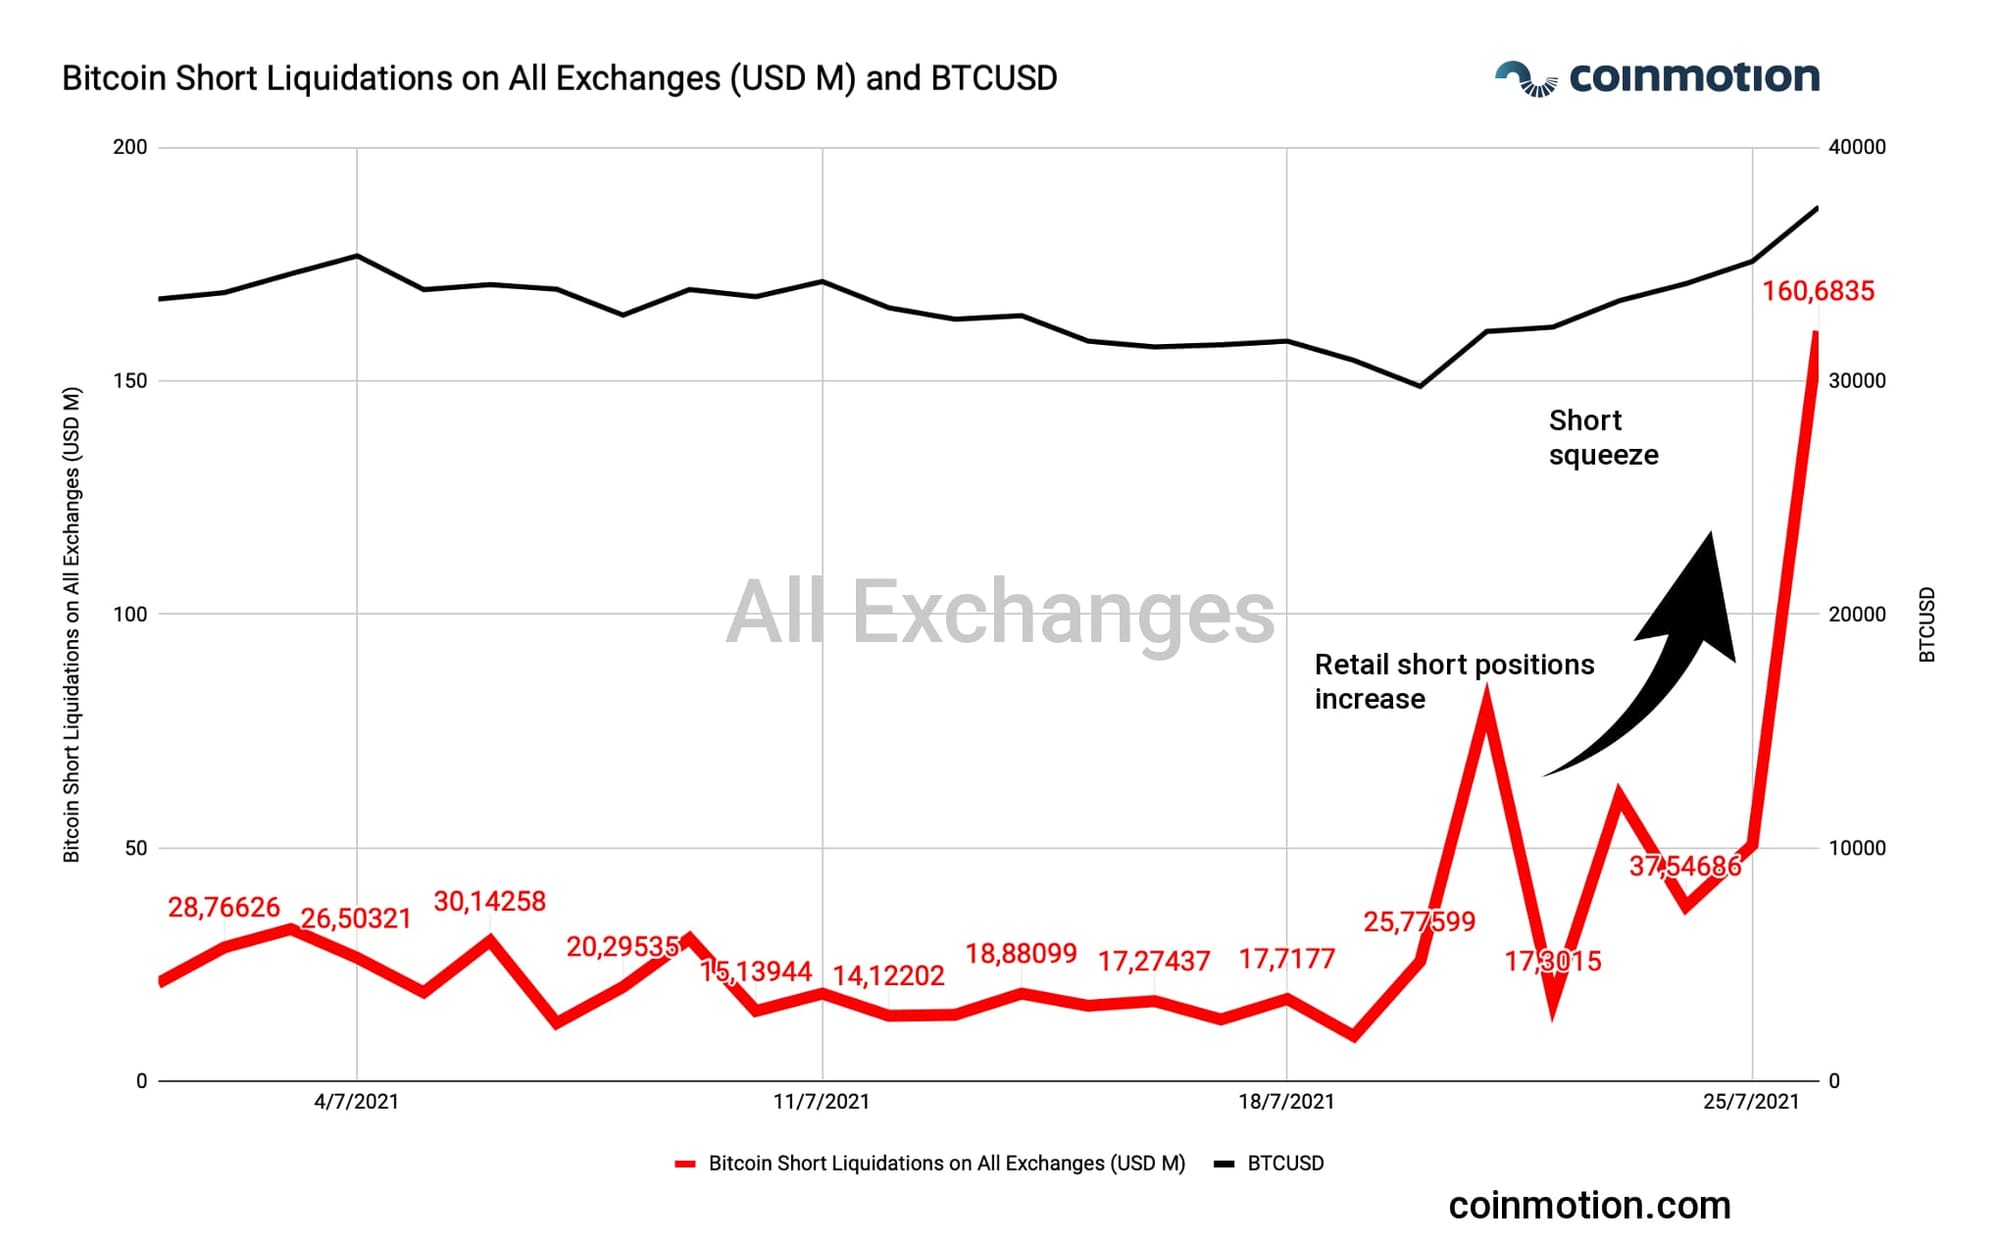
Reading open interest and funding rates
Two numbers show how crowded the leverage is. Open interest is the total value of derivative contracts that are still open. Funding rates are the periodic payments between longs and shorts on perpetual futures. When funding stays high and positive, longs are paying to hold their positions, which signals a crowded trade.
Rising prices, rising open interest, and high funding together describe a market that a small reversal can unwind. After a liquidation cascade the picture flips: open interest drops sharply. That can look alarming, but it often means the excess leverage has been flushed out, so the next move starts from a less crowded base.

Market structure: How much money it takes to move BTC
Global macro liquidity describes monetary conditions from the top down. Market microstructure works from the bottom up. It is the shape of exchange order books, and it dictates how much order flow it takes to move the price by a given percentage. A few mechanics drive Bitcoin’s volatility:
- Liquidity fragmentation. Despite a market cap of well over $1 trillion, Bitcoin’s liquidity is split across dozens of exchanges. Order-book depth at any one venue can be thin, which amplifies price moves.
- Order book imbalance. An order book is a tug-of-war between buyers and sellers. When selling outweighs buying and resting bids can’t absorb the flow, the price falls.
- Sell walls (ceilings). Thick stacks of sell orders cap rallies, because buyers have to absorb all of it before the price can climb further.
- Buy walls (floors). The mirror image: dense clusters of buy orders can act as temporary floors that absorb selling. Walls aren’t promises, though. Traders can pull them before the price arrives, so a wall vanishing is itself a signal.
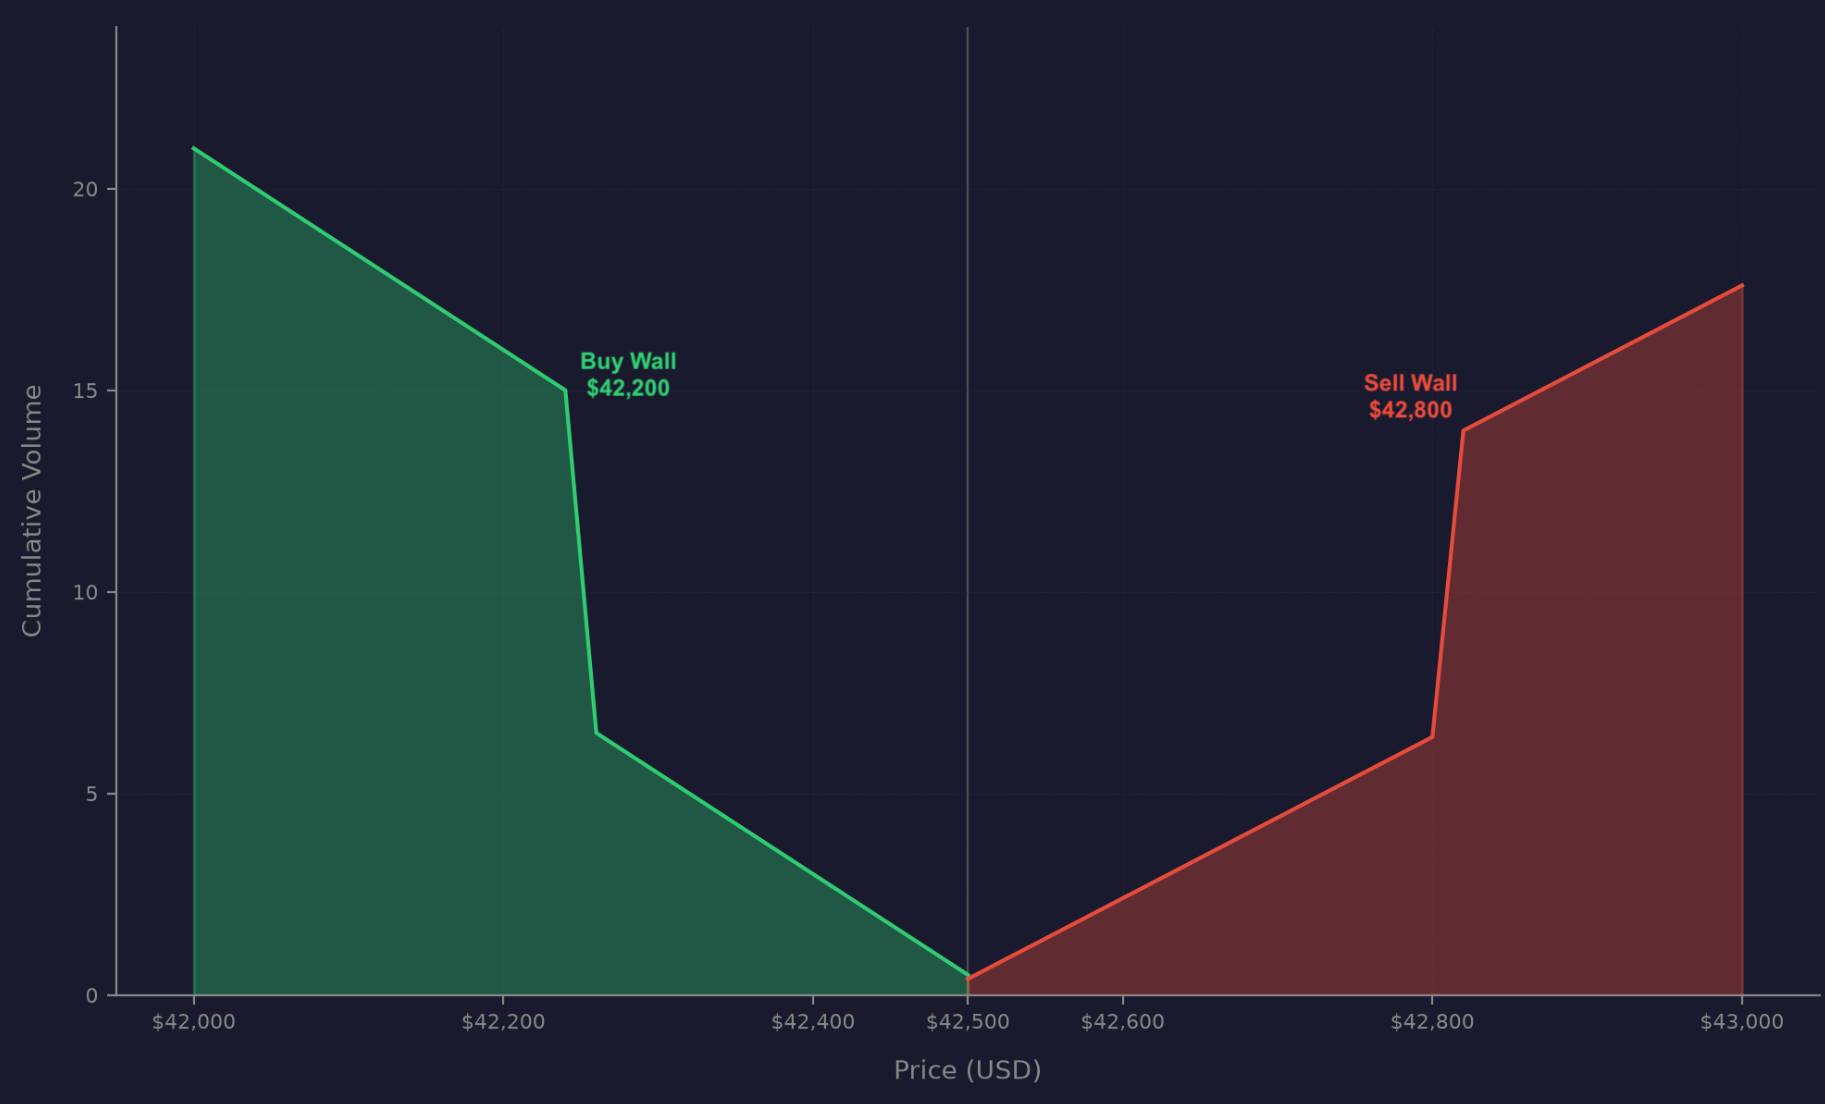
Weekend and overnight liquidity
Outside traditional banking hours, less capital and settlement activity flows in from traditional finance. Order books get shallower as resting orders shrink, and weekend volume typically runs roughly 20% to 40% below weekdays, depending on the source and period. Kaiko has tracked the weekend share of Bitcoin trading shrinking since spot ETFs launched, as institutional flow concentrates in weekday hours.
As a result, small orders have a bigger price impact, and thin books trip stop-losses and force leveraged positions to close. When a wave of liquidations hits, exchange engines market-sell or market-buy collateral into an already empty book, which is how several multi-billion-dollar flushes have happened in thin-liquidity windows. In early February 2026, a weekend drop of around 4% reportedly triggered about $2.2 billion in liquidations across more than 335,000 traders.
Liquidity feedback cycle
Panic sets off a chain reaction across order books. Market makers, the professional traders who post constant buy and sell offers, cancel their bids or move them much lower. Their order-to-trade ratios are often very high, so pulling quotes is fast and cheap. Liquidity thins out and the price sinks.
Each incoming market sell then moves it further down, tripping stop-losses and margin liquidations, which send more market sells into an already depleted book. The result is sudden price gaps and violent crashes.
A shallow book also means smaller trades suffer high slippage, the gap between the expected price and the execution price.
Narrative and sentiment: Hardest factor to measure
Sentiment gets dismissed as vibes, but it works better as a feedback loop. Rising prices draw attention, attention brings new demand, and new demand pushes prices higher. The reverse is just as mechanical. Falling prices reduce risk appetite, which leads to deleveraging, forced selling, and further declines.
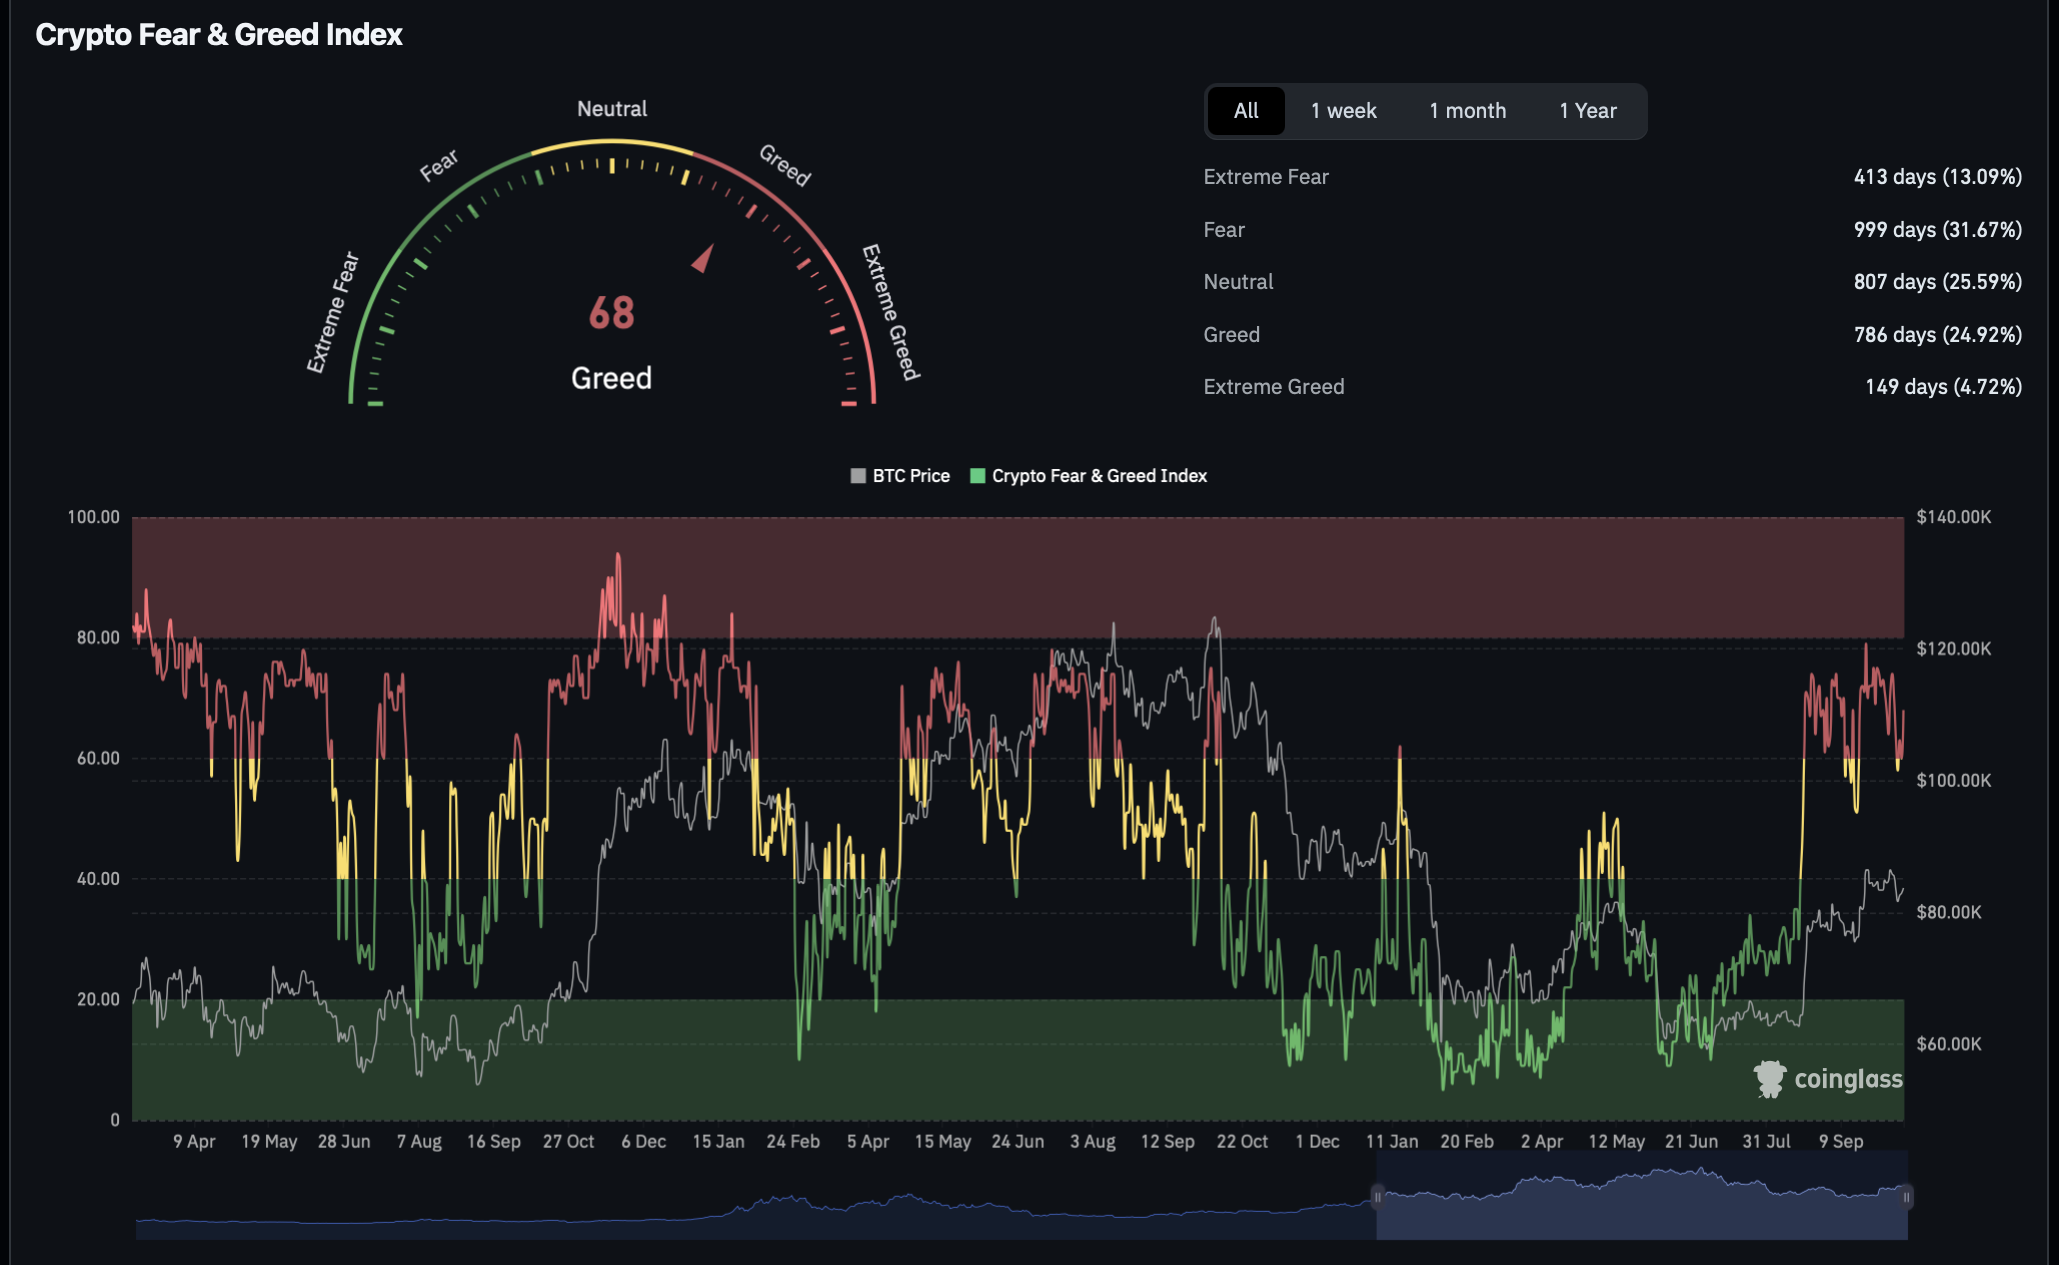
Traders call this reflexivity: the price changes the story, and the story changes the price. A few indicators put numbers on it:
- Search and social interest show when attention is arriving, though spikes often follow price rather than lead it.
- Fear & Greed-type indices blend inputs like volatility, momentum, and social data into one reading. Treat them as a summary, not a signal.
- Media narratives, such as “digital gold” or the “ETF era,” shape which data points people notice.
- Funding rates show how crowded leveraged positioning has become.
- Options skew compares the implied volatility of puts and calls. When traders pay up for downside protection, skew tilts bearish.
Sentiment rarely acts on its own. It usually amplifies a force that is already moving the market, which is why extreme readings tend to show up alongside heavy leverage and thin liquidity.
How the forces interact
Part one showed how the macro forces combine. The internal ones work the same way, and they set how fast and how far a macro move travels.
On the way up, easier financial conditions raise risk appetite and ETF inflows increase. Available supply tightens as coins leave exchanges, and the price rises. Short positions get liquidated, and that forced buying adds fuel. Momentum then attracts new buyers, which pulls more attention and more leverage into the trade.
In a deleveraging cycle, the chain runs backward. Tighter conditions cut risk appetite, ETF flows turn negative, and the price falls. Leveraged longs are liquidated, market makers pull their bids, and the thinner book makes each forced sale move the price further. Long-term holders who keep their coins off the market are what eventually puts a floor under the move.
That is why a halving, a rate cut, or an ETF inflow can’t be labeled bullish or bearish on its own. What matters is what else is happening when it lands. A rate cut into crowded leverage and thin books can end very differently from the same cut into a market that has just been flushed.
Which factors matter most, and when
The factors that tend to dominate depend on the time horizon:
- Hours to days: leverage, liquidations, order-book liquidity, positioning
- Weeks to months: ETF flows, macro expectations, investor positioning, stablecoin liquidity
- Months to years: adoption, institutional allocation, supply dynamics, network fundamentals
There is no permanent hierarchy. During a liquidation event, leverage can dominate everything else. During a prolonged institutional accumulation phase, spot demand and available supply may matter more. A useful habit is to ask which clock a move is running on before deciding which force explains it.