What drives Bitcoin's price? The macro forces at play

Bitcoin has evolved from a niche experiment into a $1.7 trillion market, sitting on the same institutional balance sheets and trading desks as conventional assets. But its valuation model is still dramatically different from TradFi. No single metric can consistently explain its moves, since the price reacts to changes in demand, liquidity, and positioning across time horizons ranging from minutes to years.
TL;DR
- Bitcoin has no single price driver. Some forces move it over minutes or days (leverage, liquidations, ETF flows); others shape it over months or years (adoption, supply dynamics, institutional allocation).
- Bitcoin increasingly trades like a macro asset — its 30-day correlation with the Nasdaq-100 sits near 96% as of October 2026, up from its early days as an isolated, retail-driven market.
- Global liquidity (M2) is the broadest driver. Bitcoin has historically moved in the same direction as global M2 roughly 83–87% of the time over multi-year periods.
- Rate cuts don't automatically mean a rally. What matters is why rates are falling — a proactive "soft landing" cut tends to fuel Bitcoin, while a reactive "hard landing" cut can trigger a sell-off alongside everything else.
- Spot Bitcoin ETFs created a direct, mechanical link between fund flows and spot demand — inflows pull BTC out of circulation, outflows push it back in.
- Institutional demand is bigger than ETF flows alone. Corporate treasuries, direct custodial holdings, and basis-trade arbitrage all add to the picture, and most of it isn't visible in ETF data.
- These forces reinforce or offset each other rather than acting independently, which is why Bitcoin's price is better understood as a feedback loop than a checklist.
Bitcoin has no single price driver
Bitcoin is an evolving digital store of value, splitting the difference between scarce digital gold and a volatile macro risk asset. Without cash flows, built-in yield, or a conventional valuation model, Bitcoin reacts to a broad spectrum of market and macroeconomic forces.
Some operate over minutes or days: leverage, liquidations, ETF flows. Others work over months or years: adoption, supply dynamics, institutional allocation.
Bitcoin's price ultimately reflects the interaction between demand, available liquidity, and the amount of BTC entering or leaving the market. The trajectory at any given point in the cycle depends on which factors are dominant.
Why Bitcoin trades like a macro asset
Bitcoin started as an isolated, retail-driven speculative asset. Today, it has become an institutionalized gauge of global liquidity that responds directly to macroeconomic conditions.
As of October 2026, Bitcoin's 30-day correlation with the tech-heavy Nasdaq-100 (QQQ) sits near an astonishing 96%. When macro events — employment data, inflation prints, Federal Reserve policy shifts — force institutional asset managers to de-risk their tech portfolios, Bitcoin tends to get sold in tandem.
The price is no longer dictated entirely by crypto-native events like the halving. Instead, three fundamental pillars bind its performance directly to the broader economic machinery: sensitivity to global money supply, deep institutional integration via spot ETFs, and its role as a global financial "exhaust valve."
1. Global liquidity: The macro force behind risk appetite
Macro drivers form the environment where all the other factors operate. The broadest of all is global liquidity (M2) and central bank monetary expansion. Over multi-year blocks from 2013 to 2024, BTC has moved in the same direction as global M2 roughly 83% to 87% of the time, outperforming traditional risk assets in pure liquidity elasticity.
Two things explain this. First, BTC is a scarce, global digital commodity. When the global money supply expands, some investors buy it as a potential hedge against currency debasement — its fixed 21-million supply cap and lack of counterparty risk make it act like a high-beta liquidity sponge. Second, general investor risk appetite tends to grow alongside liquidity: investors who view BTC as a "risk-on" asset buy more of it as liquidity expands.
Bitcoin also functions as a forward-looking indicator of marginal credit conditions. According to research by analysts like Raoul Pal and platforms like Newhedge, BTC often leads published global M2 data by roughly 10 to 12 weeks.
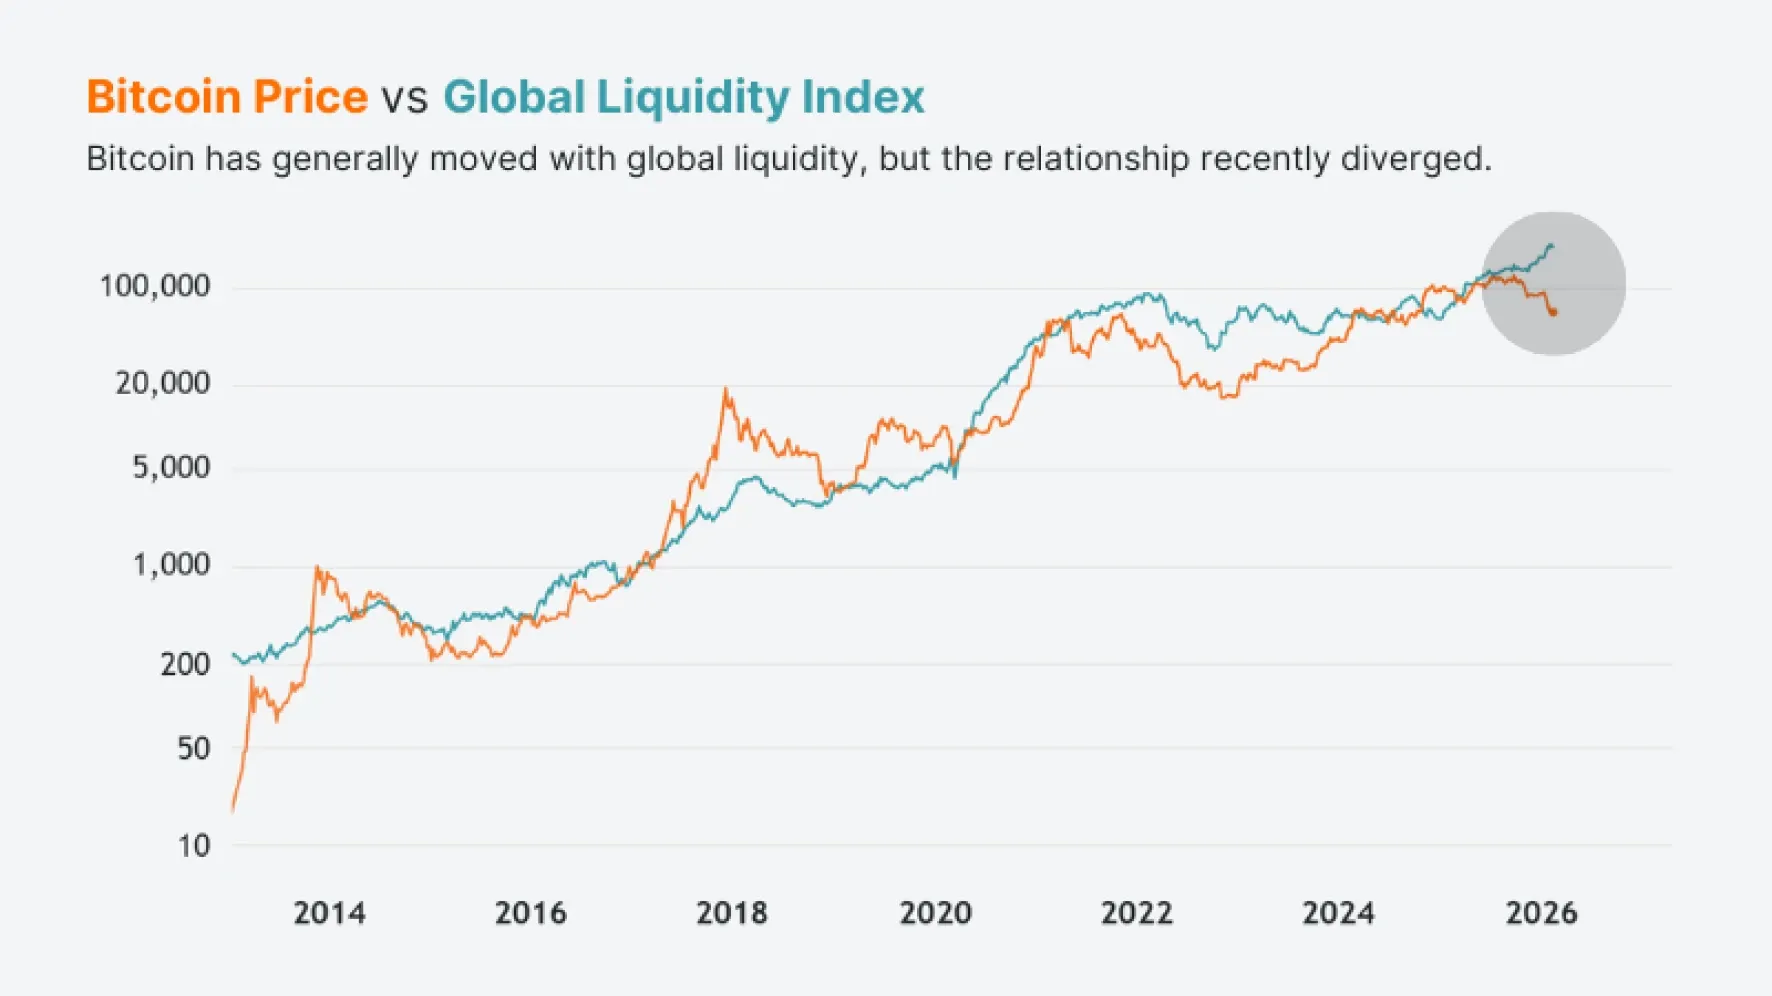
With no cash flows, corporate earnings, or industrial use case behind it, Bitcoin's value behaves like a pure, long-duration option on global liquidity expansion and monetary inflation. When central banks, primarily the Fed, expand the money supply or lower interest rates, excess capital searches for high-beta returns, and that disproportionately pushes Bitcoin up.
This relationship expands and contracts over time. It has driven major liquidity-fueled bull markets, but it has also broken down repeatedly — in 2019, 2020, 2022, 2024, 2025, and again more recently.
2. Interest rates and yields
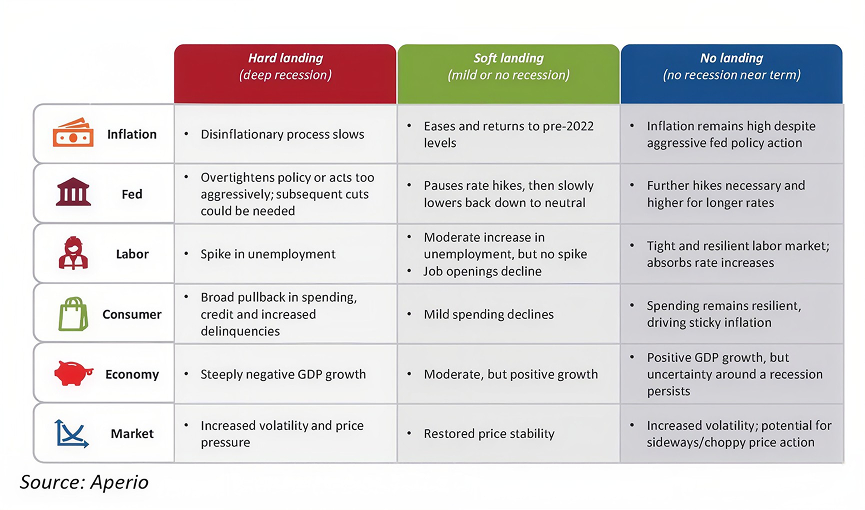
Crypto headlines often link Bitcoin's price to Fed rates directly, but the relationship is far more complex than that. "Fed cuts equal Bitcoin goes up" is an oversimplification — what actually matters is why rates are moving, and whether the easing cycle is proactive (a soft landing) or reactive (a recession panic).
Scenario A: Soft landing
Here, it's systemic liquidity expansion, not the nominal policy rate itself, that drives Bitcoin's risk-on surge. Proactive, pre-emptive cuts inject fresh liquidity and let inflation cool naturally — these are "insurance cuts" meant to help the economy avoid a major contraction, and everything tends to feel orderly, like a plane landing smoothly on a runway.
Because the economy stays strong while the Fed keeps lowering the cost of borrowing, this scenario is the ultimate fuel for Bitcoin. With short-term yields falling, investors get bored holding cash or safe bonds that pay less and less, and that capital flows into growth assets instead. With no forced liquidations or margin calls dragging things down, Bitcoin and tech stocks usually head into a major bull market together.
Scenario B: Hard landing
The alternative scenario is a "hard landing," where reactive cuts trigger forced deleveraging. This usually happens when the Fed has to cut aggressively just to catch up with rapidly deteriorating economic data. In this case, Bitcoin typically sees an initial steep sell-off alongside equities.
Credit spreads blow out in this panic scenario — the trust gap between safe government investments and risky company investments widens so sharply that companies find it almost impossible to borrow.
Capital flees the chaos and floods into safe US government bonds, pushing their prices up and yields down sharply. If the panic is severe enough, investors get desperate enough for cash that they start selling everything, including their safe government bonds and their Bitcoin.
Scenario C: No landing
There's a third possibility that doesn't fit neatly into either camp: a "no landing," where the Fed cuts rates even as inflation stays stubbornly above target. This isn't a clean soft landing, since inflation never actually cools, and it isn't a hard landing either, since the economy keeps growing rather than cracking.
Bitcoin's reaction here tends to be mixed rather than directional. The rate cuts still inject liquidity, which can support a rally in the short term. But sticky inflation alongside easing policy raises a harder question: is the Fed cutting because the economy needs it, or because it's losing the fight against inflation?
If markets start reading it as the latter, that uncertainty about Fed credibility can offset the liquidity tailwind, making Bitcoin's response choppier and less predictable than in either of the first two scenarios.
Real yields and dollar strength
Treasury yields, like the 10-year US Treasury note, affect Bitcoin by changing the opportunity cost of holding non-yielding assets and by shifting global liquidity conditions. When yields rise, investors can earn a guaranteed, risk-free return, say 5%, backed by the government. Since Bitcoin pays no interest or dividends, high yields raise the cost of holding it instead of cash or bonds.
Context matters here too. Yields driven by Fed tightening typically hurt Bitcoin, while yields rising from debt fears can actually boost it as a fiat alternative. As 10x Research founder Markus Thielen put it:
"When yields rise because the Fed is tightening, bitcoin suffers. When yields rise on fiscal and term-premium concerns, the picture flips."
Rising yields also tend to strengthen the US Dollar Index (DXY), since investors worldwide sell local currencies to buy dollars so they can access those higher-yielding bonds. Historically, Bitcoin and the dollar sit on opposite sides of a financial see-saw — since BTC is globally priced in dollars, a stronger, more expensive dollar mechanically means it takes fewer dollars to buy a single Bitcoin.
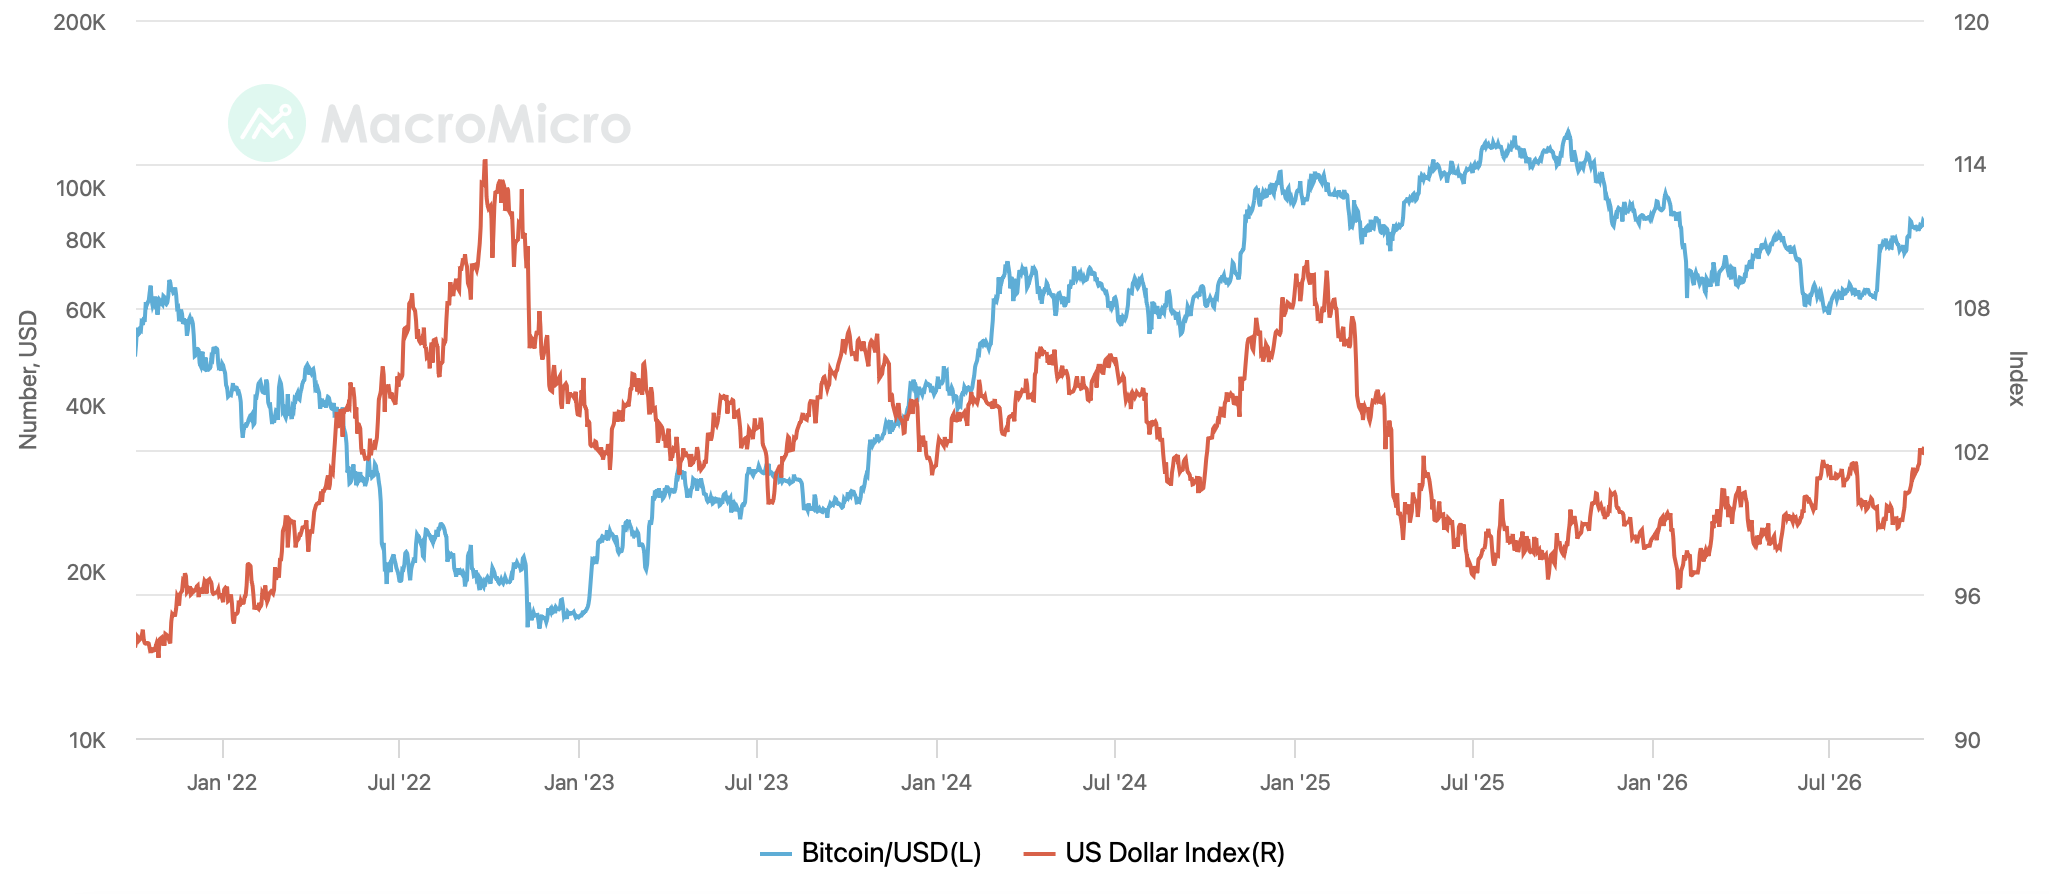
That textbook relationship holds roughly 80% of the time, but it isn't permanent, and recent data shows this inverse correlation breaking down with some frequency.
With US national debt crossing $40 trillion, the scale of government borrowing has pushed yields higher, and some investors have started treating Bitcoin less like a tech stock and more like an escape hatch from fiat currency altogether. In those moments, a surging dollar and a surging Bitcoin can climb the same hill together.
3. Expectations
Bitcoin can sometimes move ahead of actual rate cuts, because markets price in expectations rather than waiting for the event itself. Financial markets are forward-looking — they price in anticipated economic changes well before central banks officially act. Traders adjust positions anticipating a specific outcome, and investors buy or sell risk assets ahead of time.
That's why actual rate-cut days often trigger profit-taking, the so-called sell-the-news effect, since the value was already priced in beforehand. When markets anticipate a pause or a cut, bond yields and dollar strength frequently move ahead of the official Fed decision, not after it.
4. Spot Bitcoin ETFs: New demand channel
Spot crypto ETFs, like BlackRock's IBIT, create direct spot-market demand for the underlying coin, which fundamentally changes the asset's dynamics. Whenever investors buy new shares of the fund, its managers or Authorized Participants (APs) buy real, physical BTC on the open market.
Every new share has to be backed 1:1 by physical Bitcoin held in secure custody. High demand causes the fund to issue new shares, with more actual Bitcoin delivered to the custodian. Those real-time purchases remove circulating supply from exchanges and push prices up. Redemption works in reverse: the trust sells or otherwise converts the relevant BTC position and pays cash to the AP, or transfers actual BTC in the case of an in-kind redemption.
ETF inflows remove Bitcoin from circulation; outflows force the fund to sell real Bitcoin back into the market. Either way, a strict mechanical effect takes place, which is also why flows matter more than total assets under management for short-term price analysis.
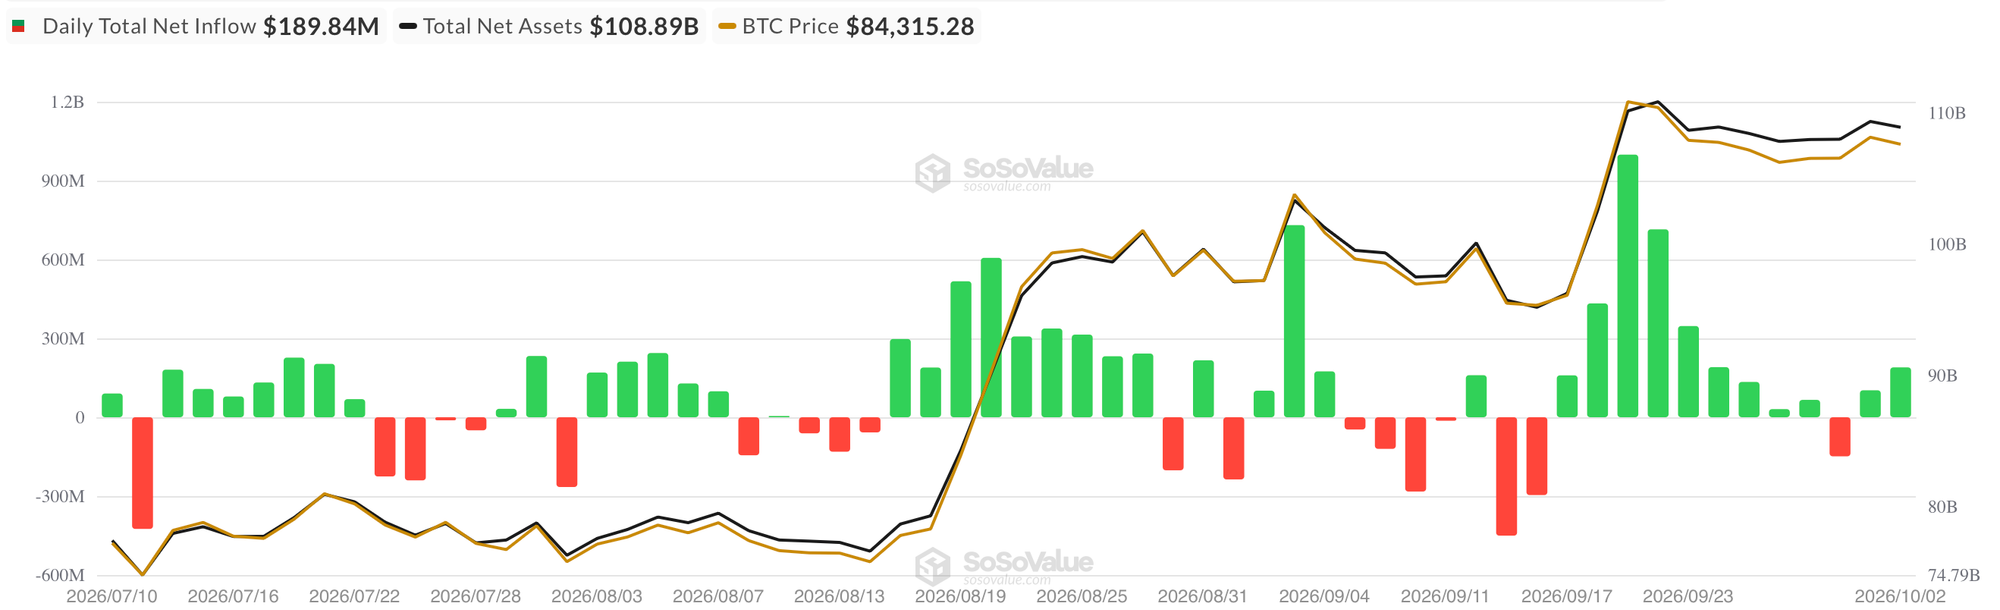
ETFs can create entirely new demand while also moving existing demand into a regulated wrapper. When these products launched in 2024, they unlocked pools of capital from institutional gatekeepers that had previously been legally and structurally barred from touching crypto, due to legal mandates, compliance rules, and security frameworks.
ETF demand isn't the whole institutional picture
ETF flows make headlines, but they represent only one slice of institutional market activity. Large organizations also buy and hold BTC directly on their balance sheets for strategic reasons that have nothing to do with fund inflows — to preserve purchasing power, for instance, or to maximize yield.
Beyond ETFs, institutional demand also includes corporate treasuries and direct institutional holdings. The largest corporate holder, Strategy, holds 847,666 Bitcoin worth roughly $64 billion at cost (the market value shifts constantly with price). SpaceX also holds 18,712 BTC on its balance sheet. At press time, 197 public companies collectively hold 1,276,699 BTC, about 6.35% of the 20.094 million BTC currently in circulation.
Direct institutional holdings, where institutions bypass ETFs entirely and hold physical Bitcoin on-chain via qualified custodians, are harder to track completely, since private entities don't file public 13F reports. Based on verified allocations, a large portion of this activity is driven by proprietary trading firms and macro hedge funds running complex arbitrage — buying large quantities of spot BTC while shorting futures to capture a premium, known as the basis trade.
5. Bitcoin as a financial "exhaust valve"
Traditional stock markets close on weekends and evenings, but macro risks, like geopolitical escalations or currency interventions, don't pause along with them. Investors use the highly liquid crypto market to express their immediate risk preference when nothing else is open, which boosts Bitcoin's volatility relative to the size of the underlying economic shift. Built-in leverage and derivatives amplify the effect further — more on that in a future piece.
How the forces interact: Feedback loop, not checklist
Bitcoin's price doesn't respond to liquidity, or rates, or ETF flows, or institutional appetite one at a time — it responds to all of them simultaneously, and they tend to reinforce each other in both directions.
On the way up, the loop looks something like this: global liquidity improves, which increases risk appetite, which pushes institutional allocation higher, which increases ETF inflows, which mechanically pulls BTC out of circulation and strengthens demand further.
Each step doesn't just add to the last one, it amplifies it. More liquidity makes institutions more willing to allocate, and ETF inflows draw down available supply at exactly the moment demand is rising, which is why liquidity-driven rallies can move faster and further than the underlying macro shift alone would suggest.
The same loop runs in reverse. Tight liquidity pushes yields higher and strengthens the dollar, which lowers risk appetite, which weakens institutional flows, and Bitcoin comes under pressure from multiple directions at once rather than just one.
This is why no single metric, not the halving, not the Fed's next move, not ETF flows in isolation, can reliably explain where Bitcoin goes next. The real answer is almost always which of these forces happens to be dominant at that specific moment, and whether the others are reinforcing it or quietly working against it.
And this is only half the picture
Everything covered here sits on the demand side: liquidity, rates, ETF flows, institutional appetite. The other half of Bitcoin's price is shaped by supply, and that story runs on a completely different clock. Our next article picks that up directly — the fixed 21 million cap, how issuance and the halving shrink new supply over time, and why miners, long-term holders, and whales don't all behave the same way once they're holding it.
It'll also dig into how much BTC is actually lost for good, what dormant supply tells us about conviction versus apathy, the split between liquid and illiquid coins, and how leverage can amplify moves on either side of that supply-demand equation. Understanding both halves is what actually explains Bitcoin's price, not just one or the other.