Clapp Weekly: Fed-driven retreat, Bitcoin enters 'Rektember,' Robinhood Chain breaks records

BTC price
Bitcoin is trading choppily near $77k after retreating from Fed Chair Kevin Warsh’s hawkish speech last Friday. The coin initially appeared to shrug off $90 oil and rising bond yields, in contrast to gold and the S&P 500. One explanation is that rising yields reflect fiscal concerns rather than economic growth, boosting demand for hard assets outside the fiat system. That resilience has since faded. Spot Bitcoin ETFs ended their nine-day inflow streak on Friday, then erased Monday’s gains on Tuesday with $236.46 million in outflows.
The BTC price climbed from $77.7k on August 26 to a weekly high of $80,591.31 on August 28, before tumbling to a low of roughly $77.0k–$77.3k the following day. The price attempted to break above $79k on August 30 but pulled back again, then made another attempt on September 1 before turning lower.
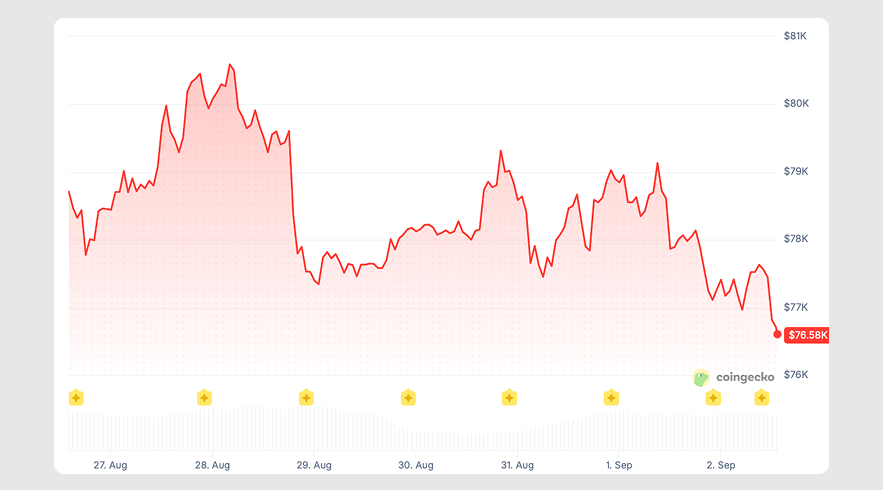
Changing hands at $76,578.24, BTC is down 1.5% over the past 24 hours and 2.5% over the past 7 days.
ETH price
Ether mirrored Bitcoin’s macro-driven decline, briefly reclaiming $2.5k on August 30 as Russia's Sberbank unveiled plans to accept ETH as loan collateral alongside BTC and USDT. Institutional demand has remained supportive: spot Ethereum ETFs extended their inflow streak to 12 days, attracting $1.85 billion in August and $10.95 million on September 1. The pace has nevertheless cooled from the August 27 peak of $234.5 million. BitMine's backing remains firm — the company purchased another 53,501 ETH last week, bringing its holdings to roughly 4.9% of total supply.
ETH climbed from $2.4k to above $2.5k on August 27 before slipping back to $2.4k two days later. It then recovered gradually, spiking to $2,527.97 on August 30 before a sharp sell-off. The price bottomed around $2.4k the next day and approached $2.5k again on September 1 before slipping back.
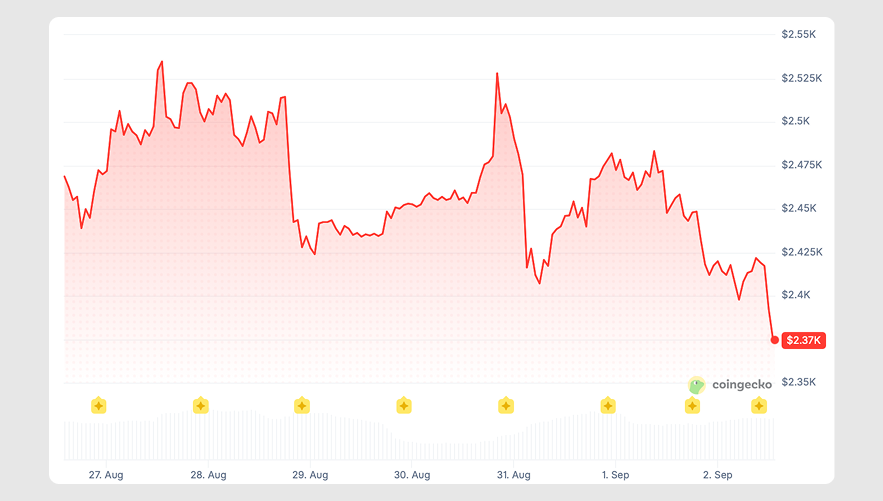
Currently at $2,370.00, ETH has lost 3.0% over the past 24 hours and 3.3% over the past 7 days.
Seven-day altcoin dynamics
Fed Chair Kevin Warsh's hawkish Jackson Hole speech rattled risk markets, wiping more than $74 billion from the crypto market cap overnight. Sentiment has cooled, with the Fear and Greed Index retreating to 62/100 (Greed), well below the 74/100 Extreme Greed reading seen on August 24.
Speaking at the annual symposium last Friday, Warsh stressed that "inflation remained too high" in July and reiterated that interest rates remain the primary tool for getting inflation back to the 2% target. He also favored data-driven decisions over forward guidance, citing the "hall of mirrors" problem and arguing that the Fed's economic outlook should be guided by "clear market signals."
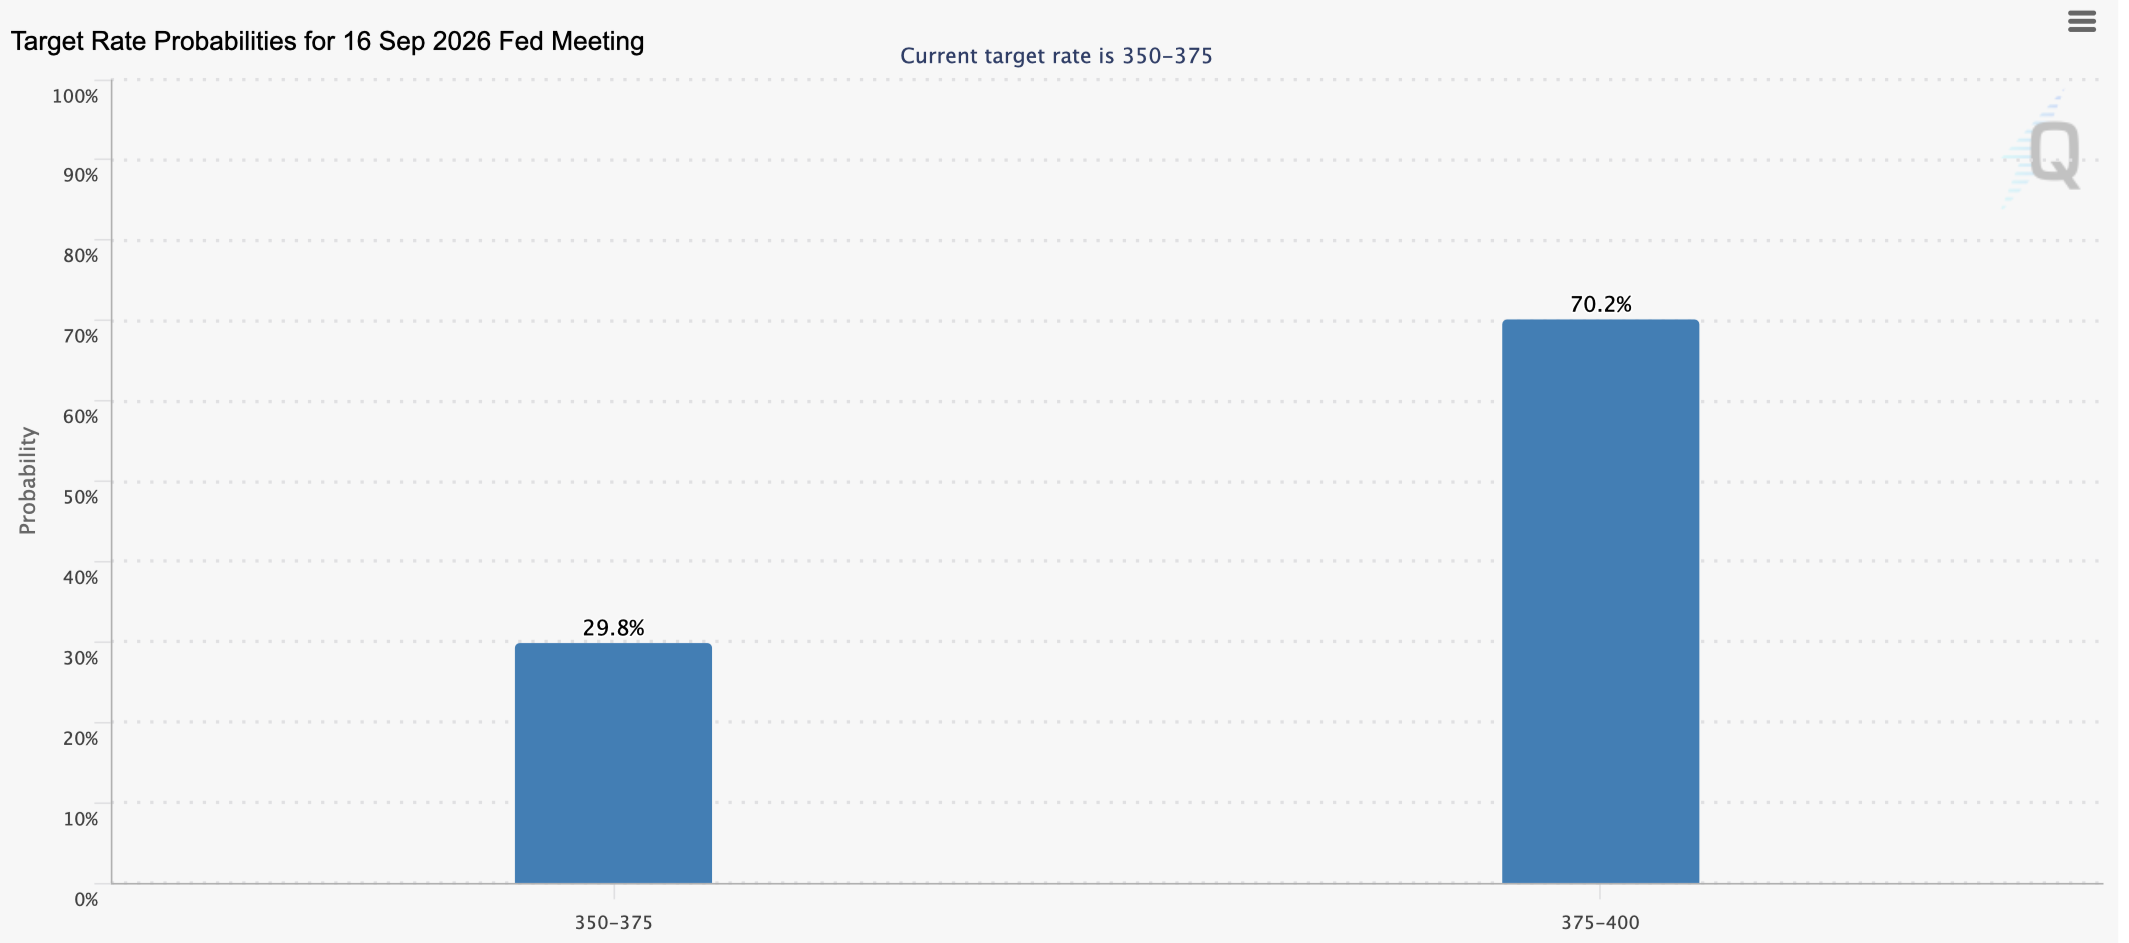
The hawkish stance triggered a global bond sell-off, with the US 10-year Treasury yield jumping to 4.784%. Gold fell more than 2% on Tuesday, while the odds of a Fed rate hike at the September 16 meeting nearly doubled to over 70%.
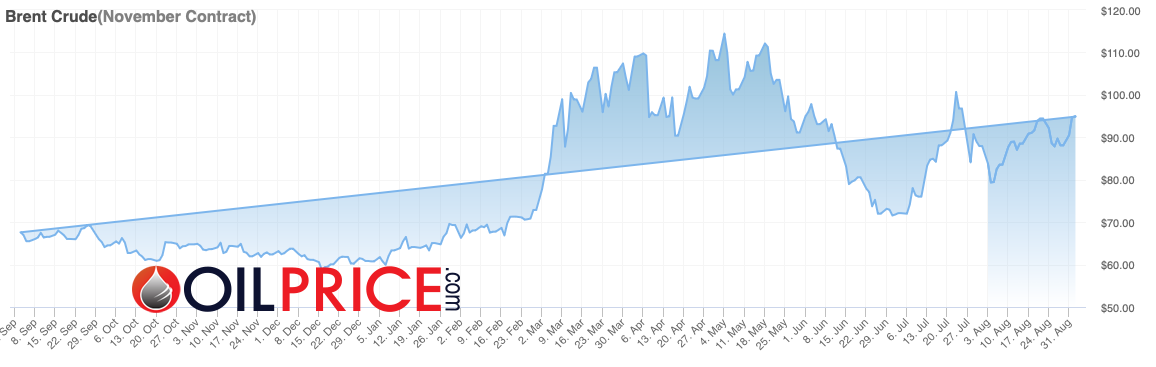
Meanwhile, Brent crude hit almost $95 a barrel, its highest level since late July, as US strikes against Iran added further pressure. The escalation reinforced expectations of a Fed hike as energy prices surged.
Altcoins forge ahead
Although Bitcoin closed August with one of its strongest monthly runs of the year, the combined market cap of the top 100 altcoins outpaced BTC, gaining 26.5% versus 24.95%. As CryptoRank noted, both average and median altcoin returns were "definitely positive," suggesting the rally wasn't concentrated in large-cap tokens.
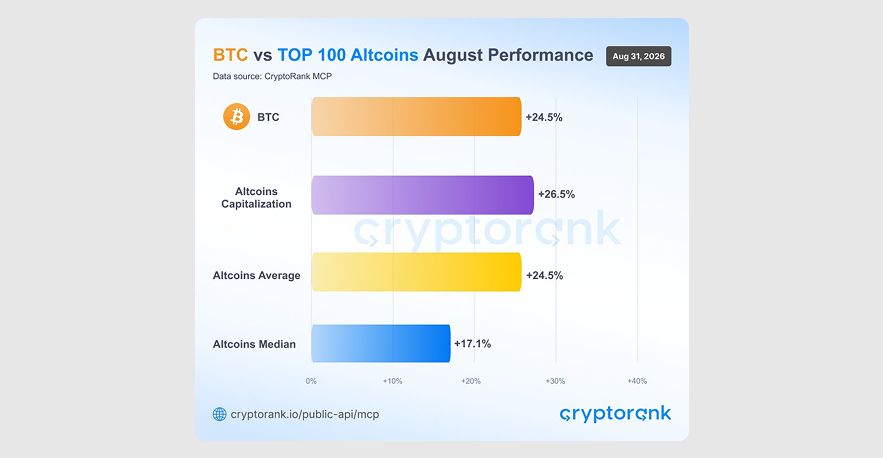
That said, the market has moved deeper into "Bitcoin Season" territory. The CMC Altcoin Season Index fell to 23 yesterday from 38 last week, with PUMP, UNI, and LIT leading 90-day gains.
Bitcoin dominance currently holds firm at 59.5%, confirming a rotation away from riskier assets. The selling pressure is particularly visible across the meme coin sector, with PEPE and M among the week's biggest losers.
XRP ETFs on a roll
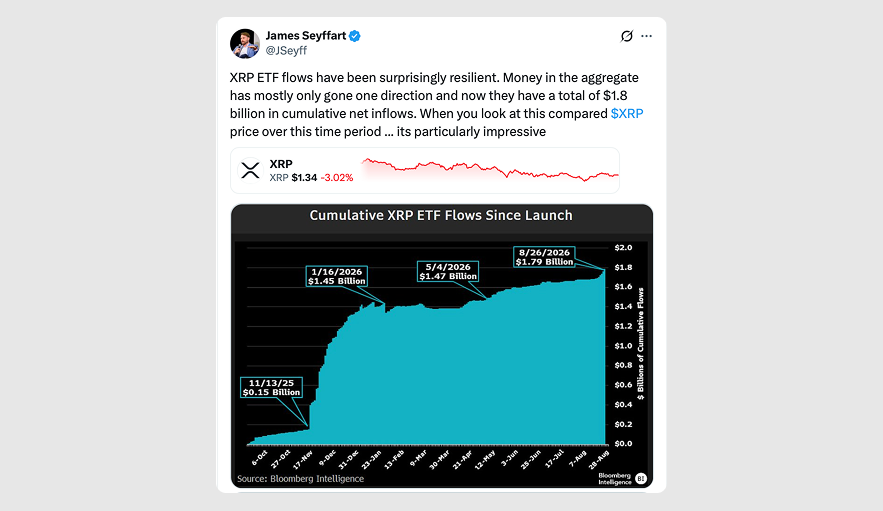
Despite the token's lackluster weekly performance, XRP ETFs have extended their inflow streak to 11 consecutive days, attracting nearly $1.7 billion since their launch in late 2025. Bloomberg's James Seyffart called the trend a "surprisingly resilient" phenomenon. Investment advisers are the top allocators to the products, with Goldman Sachs among the leading holders.
All eyes on Friday labor release
The August jobs report is due on September 4. Economists expect a dramatic rebound in payrolls to 58,000 after July's loss of 23,000 jobs, with the unemployment rate holding at 4.1%.
A hotter-than-expected reading could raise the odds of a rate hike this month, which have already doubled following Warsh's Jackson Hole speech. On the other hand, softer hiring or a rising unemployment rate could reinforce expectations that the Fed will hold rates steady.
For Bitcoin, the reaction will hinge on how the new data compares with expectations — and how traders adjust their bets on the September FOMC decision.
Top weekly winners
- UNI (+39.4%) — rose on higher protocol revenue driven by record RWA trading volumes. Daily volume on Robinhood Chain exceeded $130 million, fueling a surge in fee generation. The new chain now accounts for 69% of Uniswap's daily protocol revenue, accelerating token burns and strengthening the token's value-capture narrative.
- ARB (+20.2%) — surged amid a 586% jump in trading volume, driven by growing activity on Robinhood Chain, which sends 10% of its protocol revenue to the broader Arbitrum ecosystem. Meanwhile, the ArbBOS Elara upgrade introduced improvements to Arbitrum One and Arbitrum-powered dedicated chains.
- CRV (+9.3%) — returned to the top 100 altcoins by market cap alongside a broader rally across DeFi names in a generally risk-on session. The move was fueled by a sudden short squeeze and the August emissions halving across the protocol.
Top weekly losers
- POL (-26.9%) — lost ground after a technical breakdown and leveraged selling, with Polygon Labs disclosing previously patched security vulnerabilities in the network. The flaws included denial-of-service and consensus-hardening issues. Although Polygon says they were never exploited, sentiment took a hit.
- PEPE (-20.3%) — mirrored Bitcoin's macro-driven decline, with its high-beta profile amplifying the move. Falling trading volume (-1.21%) points to a lack of fresh catalyst-driven demand. Without a coin-specific driver, PEPE's next move will likely depend on whether Bitcoin finds a floor.
- M (-10.1%) — followed the broader rotation out of altcoins, with heavy selling volume amplifying the decline.
Cryptocurrency news
Bitcoin enters 'Rektember' — August's rally meets September's curse
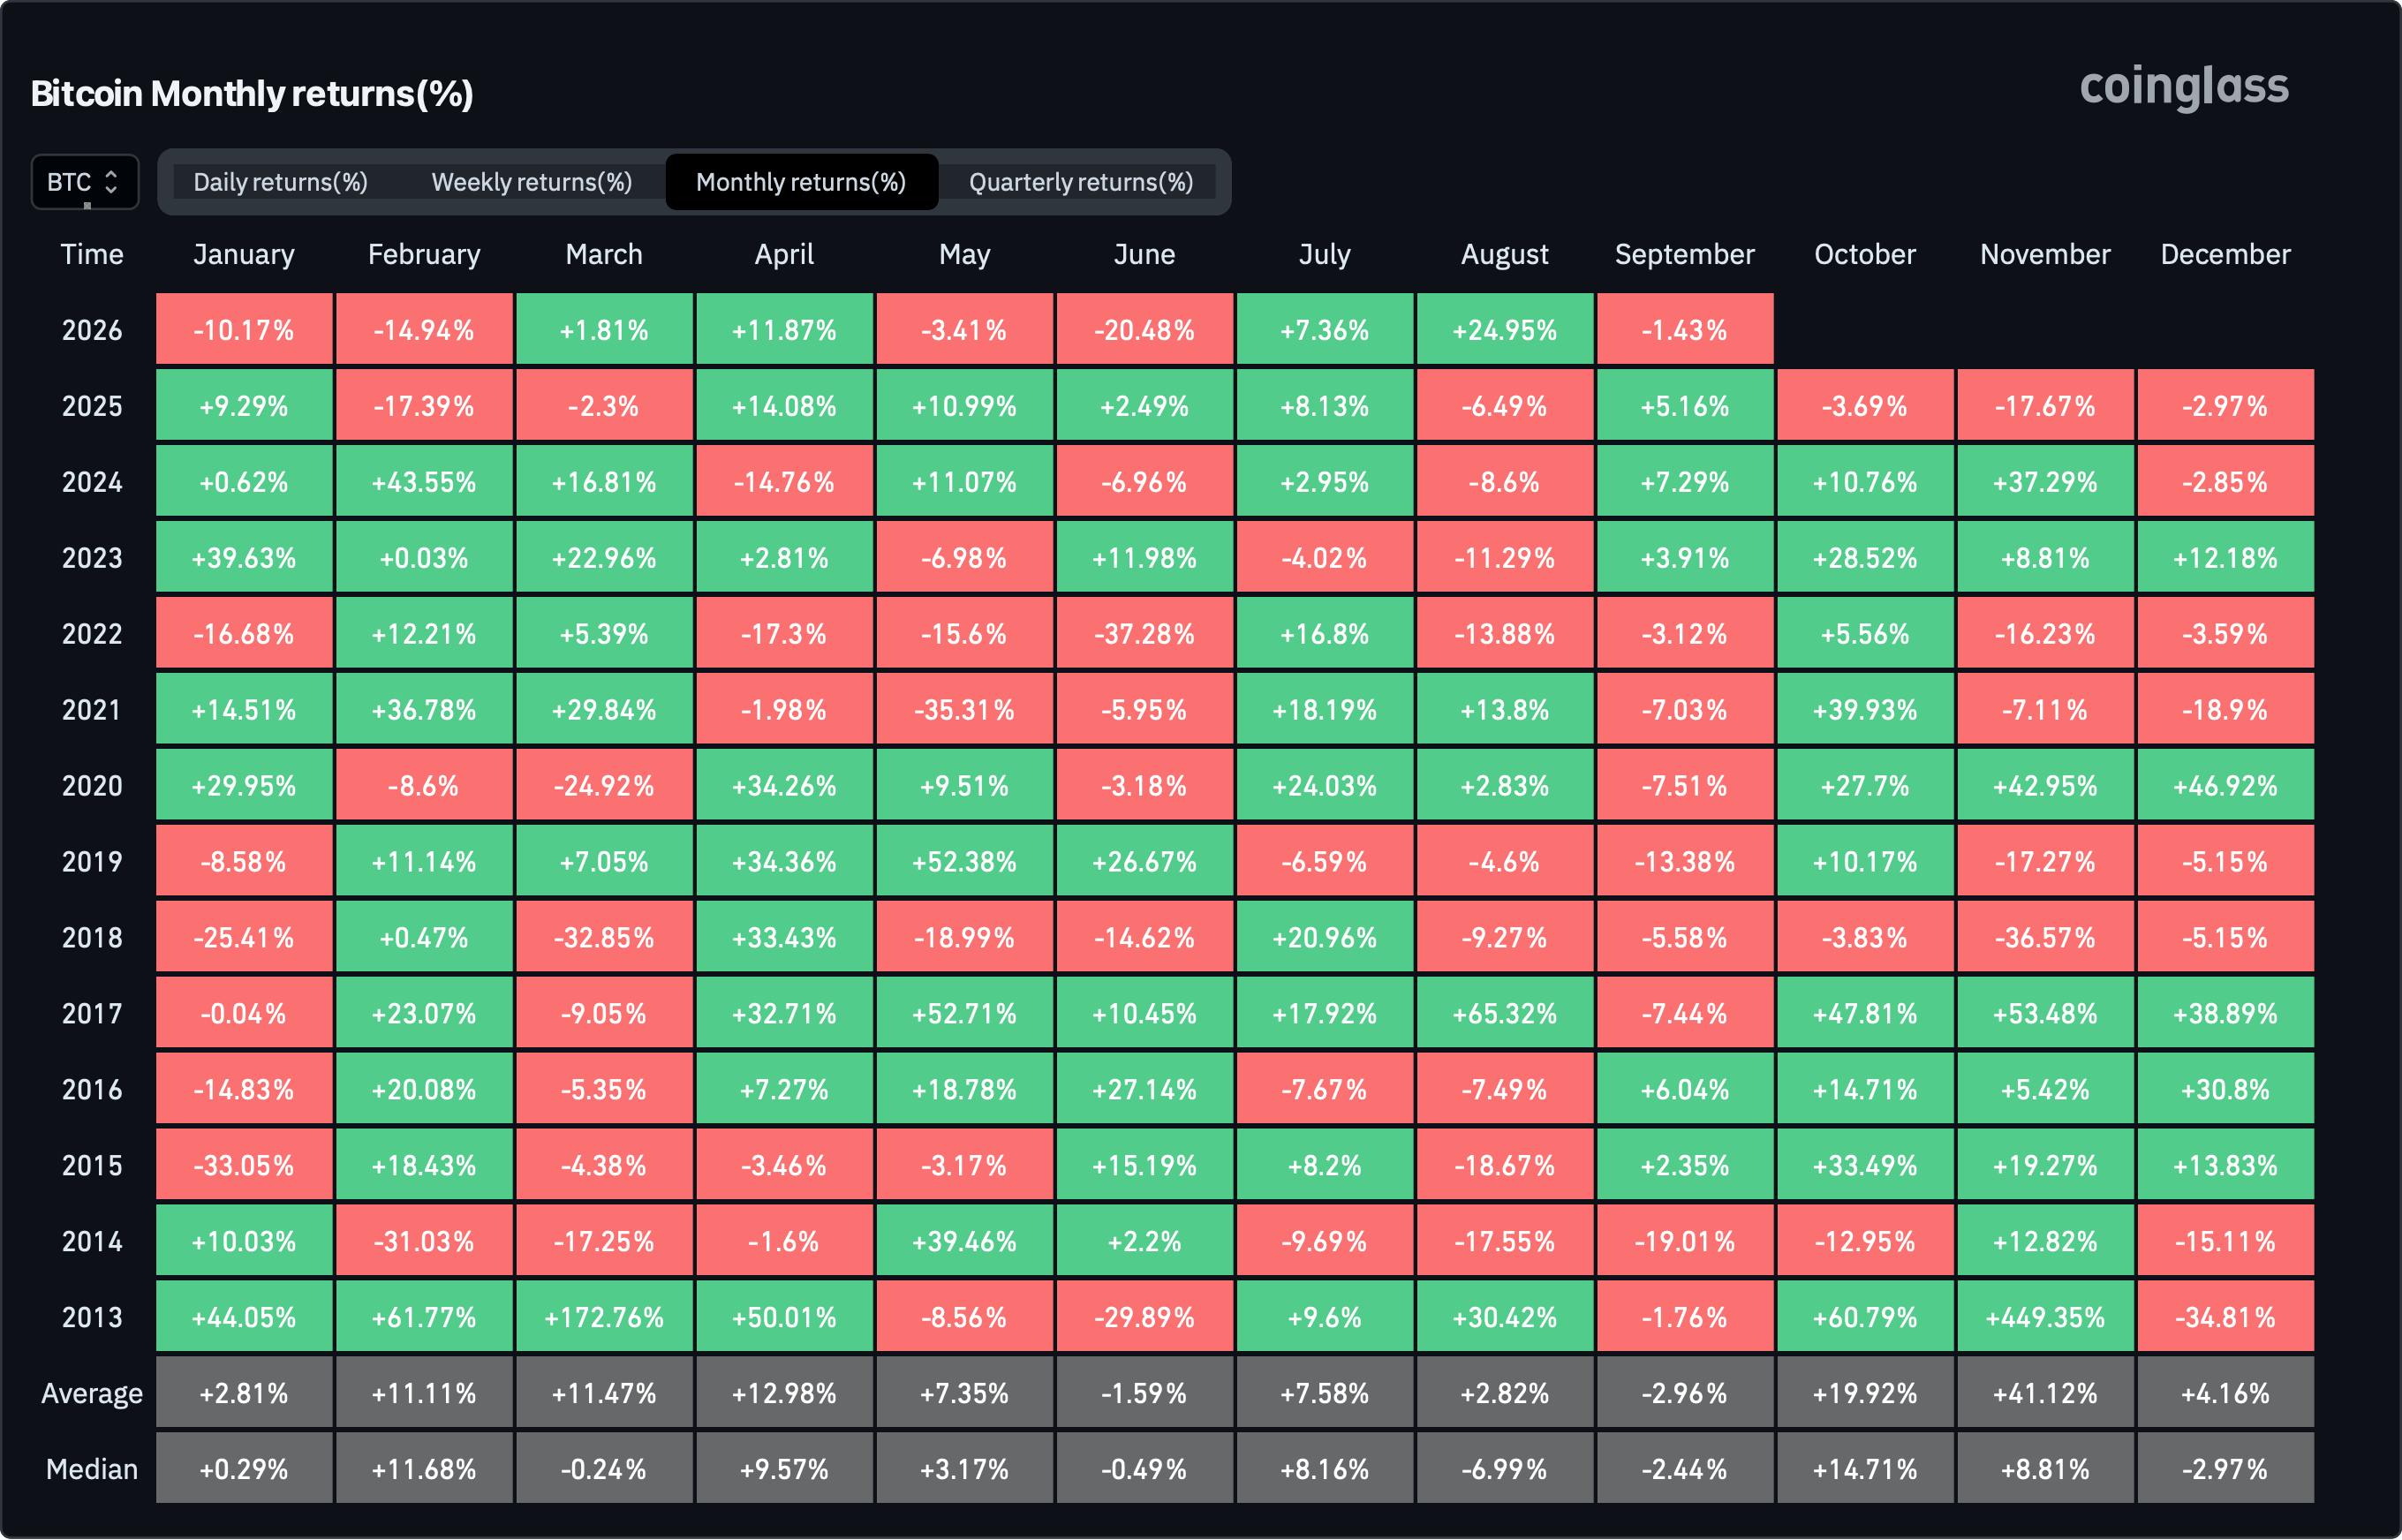
The largest cryptocurrency closed August up 24.5%, a stunning reversal from months of sideways action. But the calendar has turned, and history isn't on Bitcoin's side. Since 2013, September has been Bitcoin's worst-performing month on average, delivering a loss of around 3%. It's only produced five positive monthly returns in 13 years.
Traders call it "Rektember" for a reason.
Macro picture soured quickly
Warsh's hawkish Jackson Hole remarks pushed the 10-year yield to 4.784%, with markets now pricing a 66% chance of a September rate hike. Higher rates hit risk assets hard — gold dropped 2%, Bitcoin fell below $78k, and oil climbed to $88 a barrel as US-Iran tensions escalated (see above).
Beneath the surface
August's rally looked strong on the surface — but there were warning signs. Long-term holders used the run from $63k to $81.5k as an exit ramp. Profit-taking peaked twice in a single week. Beyond the January crash, those were the heaviest single-day sell-offs of the year so far.
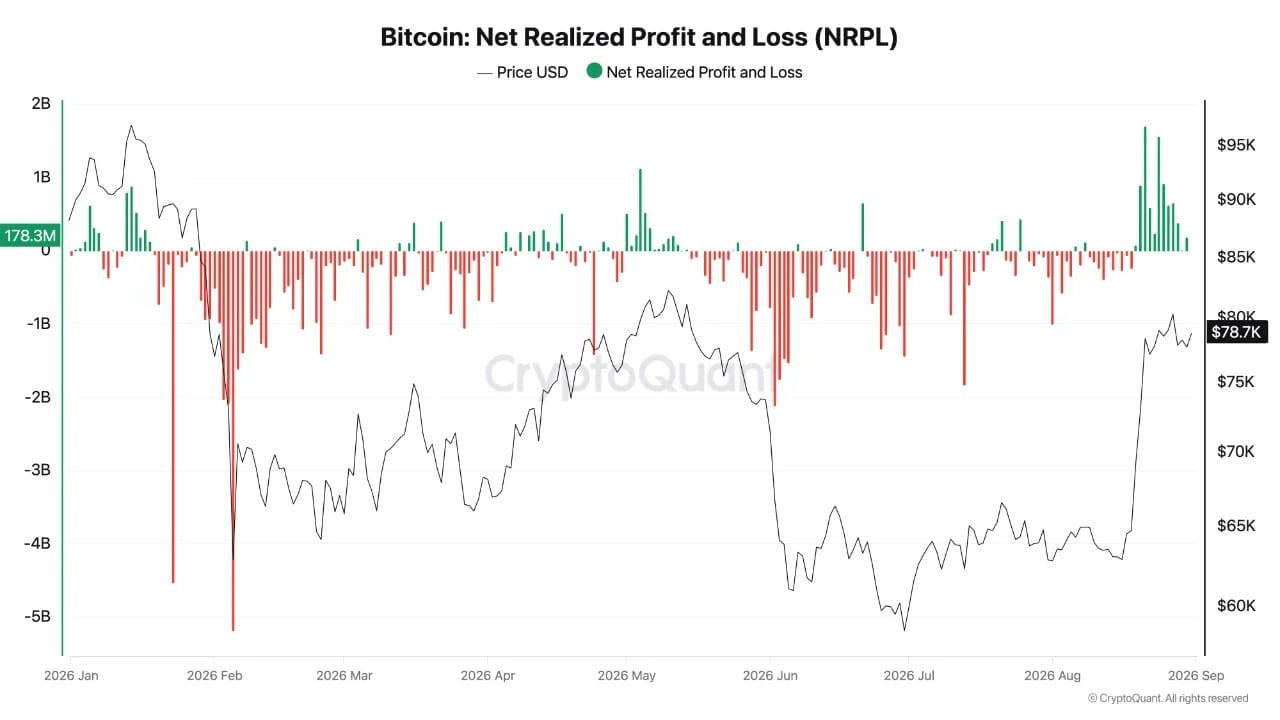
US demand turned positive for a couple of days, then vanished. Funding rates hit a yearly high, suggesting traders were leaning heavily on leverage.
DeFi lending did have its own moment, with active loans across major protocols growing 30% in two months to $26.1 billion. Aave accounted for more than half of that. But the broader picture shows a fragile rally built on borrowed confidence.
What's next
September is also the only month since 1975 where the S&P 500 has generated a negative average return. The last three Septembers have delivered gains — but that's the exception, not the rule.
For Bitcoin, the question is whether the momentum from August can carry into a historically hostile month. The headwinds are real: a hawkish Fed, rising oil prices, and profit-taking from long-term holders.
If September lives up to its reputation, the rally may be short-lived. If it doesn't, Bitcoin might finally break the curse.
Robinhood Chain just became the top fee-earning blockchain
Robinhood's blockchain experiment was supposed to be about tokenized stocks and real-world assets. Instead, it's become a memecoin frenzy.
According to Arkham, Robinhood Chain generated $2.13 million in chain fees in just 24 hours as September began— more than Solana, Base, and even Ethereum. The network, launched just two months ago, has processed a record 5.52 million transactions in a single day.
The numbers are staggering
DEX trading volume hit $1.49 billion in 24 hours, breaking Friday's record of $989 million and placing it second only to Solana. Total value locked has climbed to $740 million, a 23% increase over the past week. Stablecoin supply stands at roughly $770 million, up 47% month-over-month.
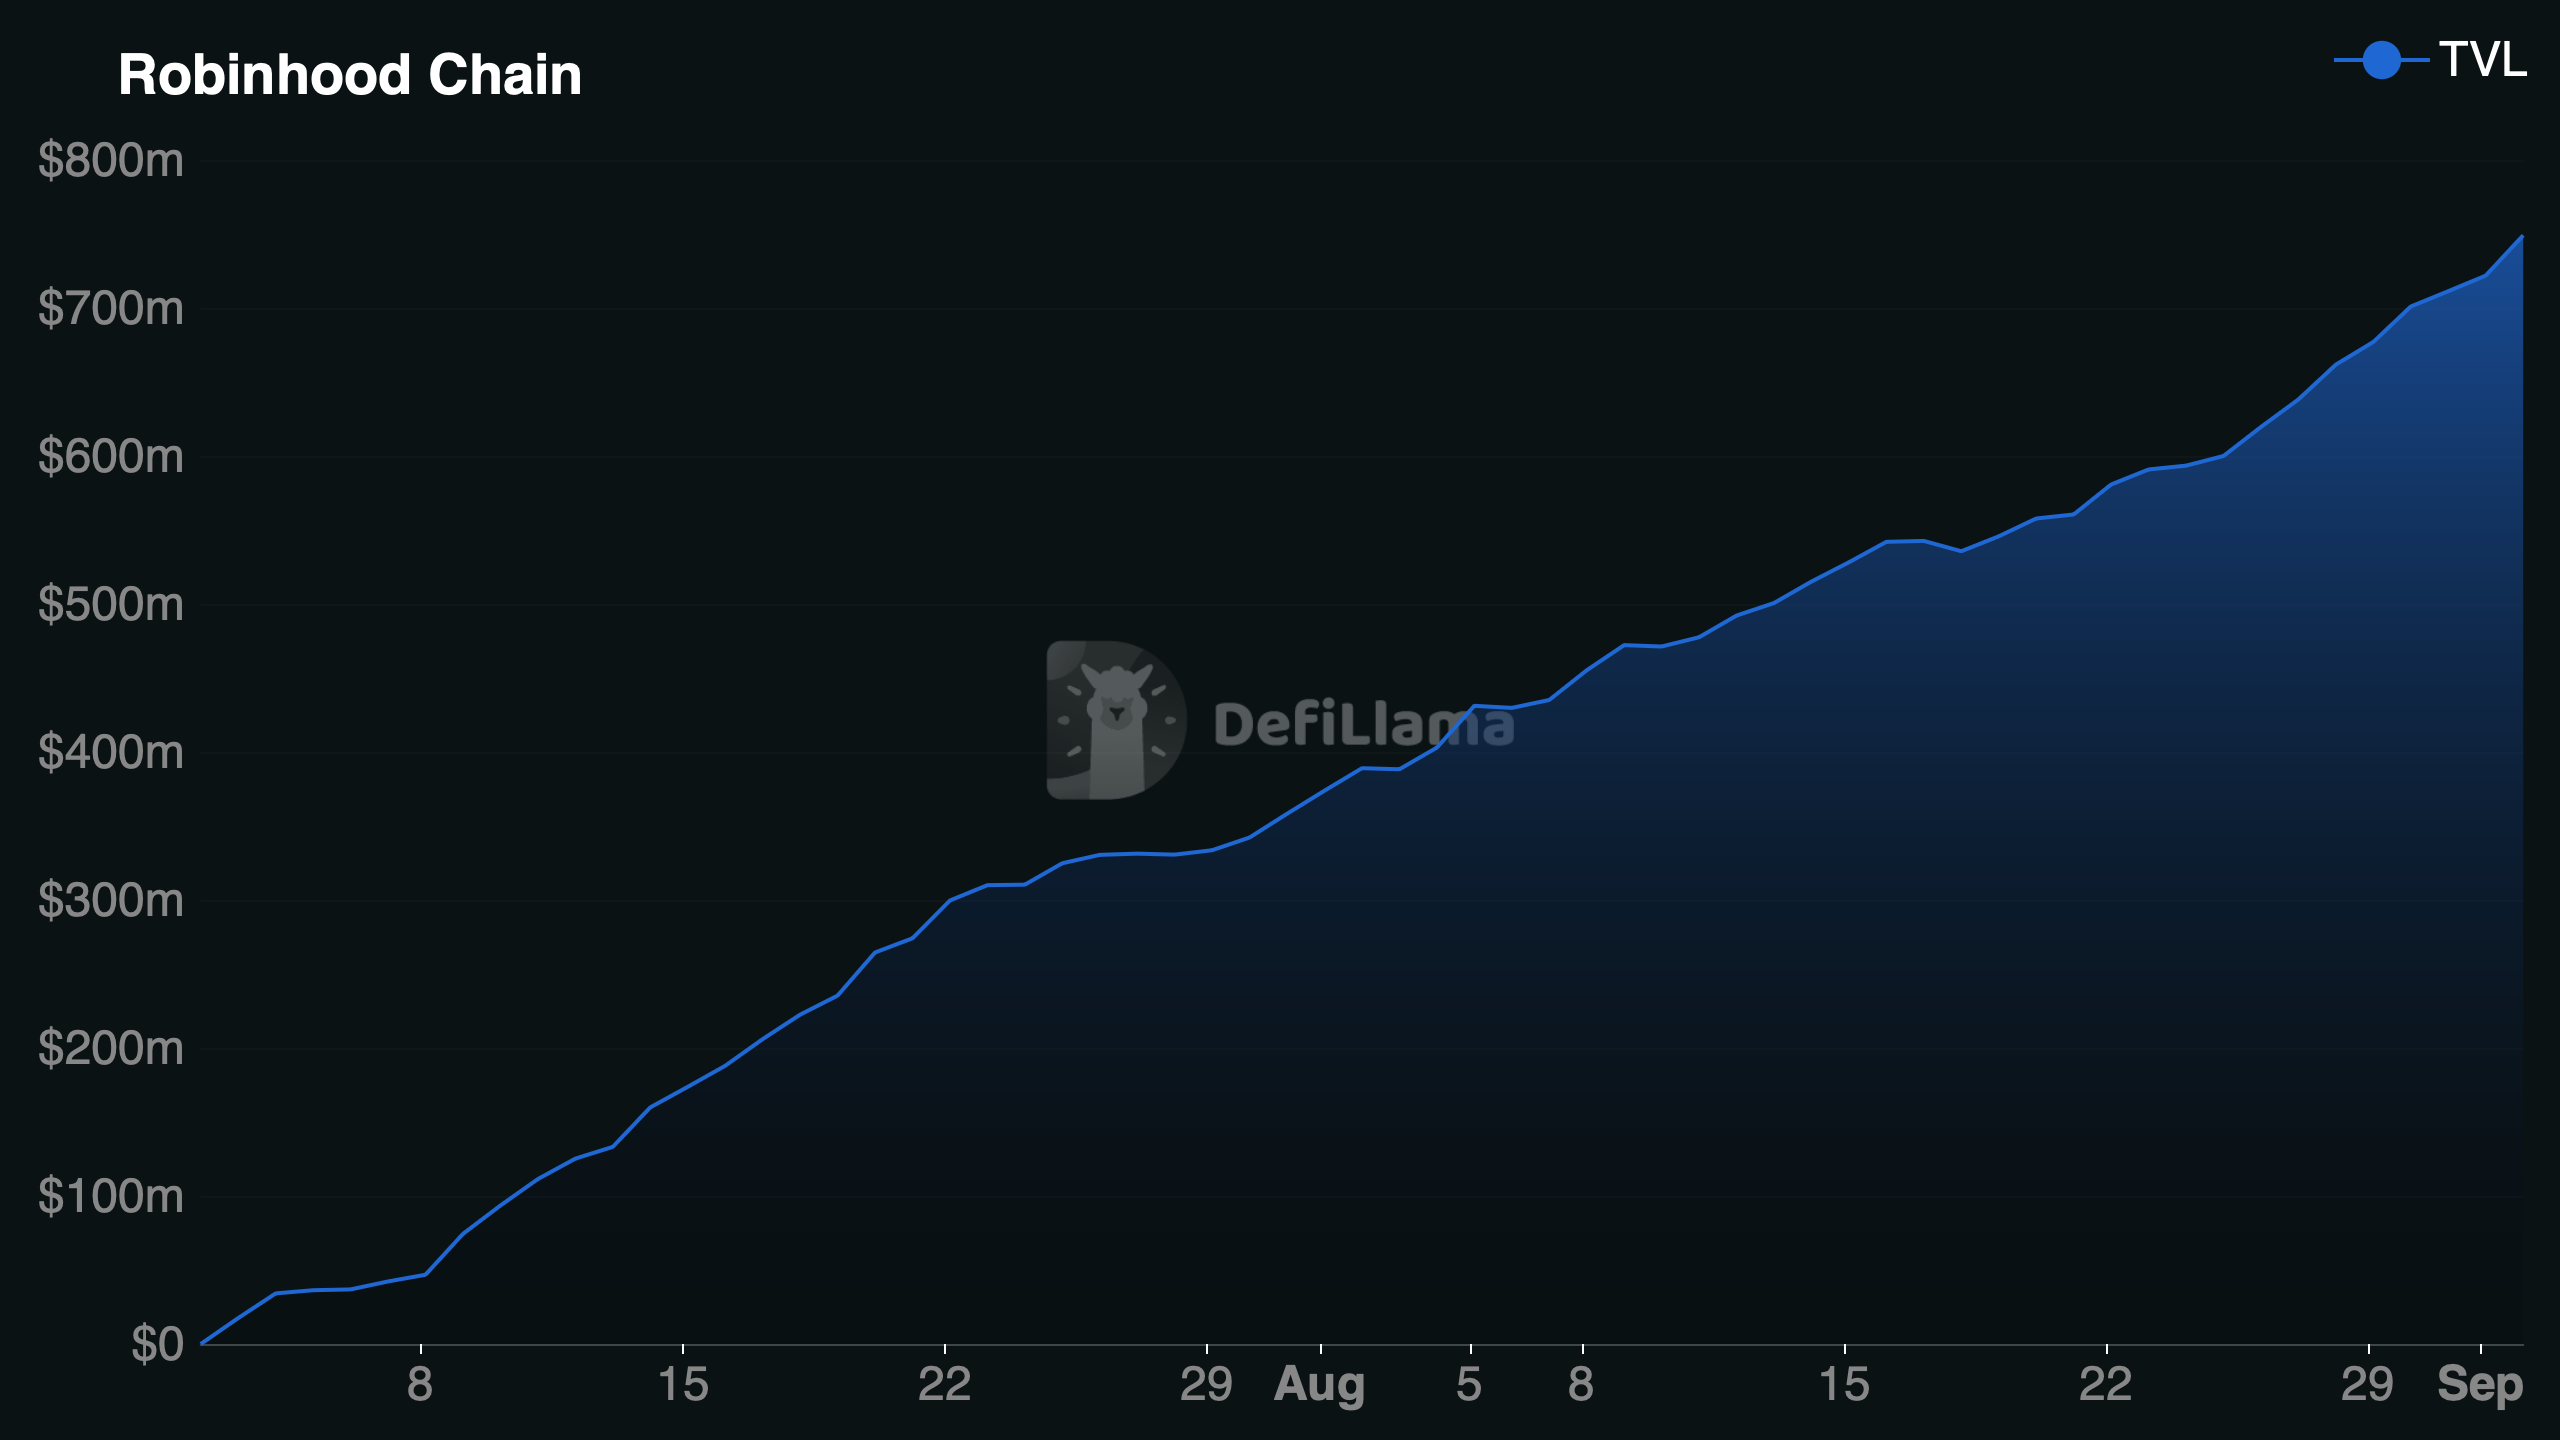
But what's really interesting is how the chain got there.
Memecoin mania meets Wall Street
Robinhood Chain was designed around tokenized equities — letting users trade shares of Apple, Nvidia, and Tesla onchain. But the activity has shifted. Memecoins now dominate, and they're being paired against tokenized stocks in a new trading meta.
Pons, a token launch platform, launched roughly 22,600 tokens on August 30 alone. GMGN generated $1.11 million in application fees in 24 hours, while Pons added $930,000 and Uniswap chipped in $307,000.
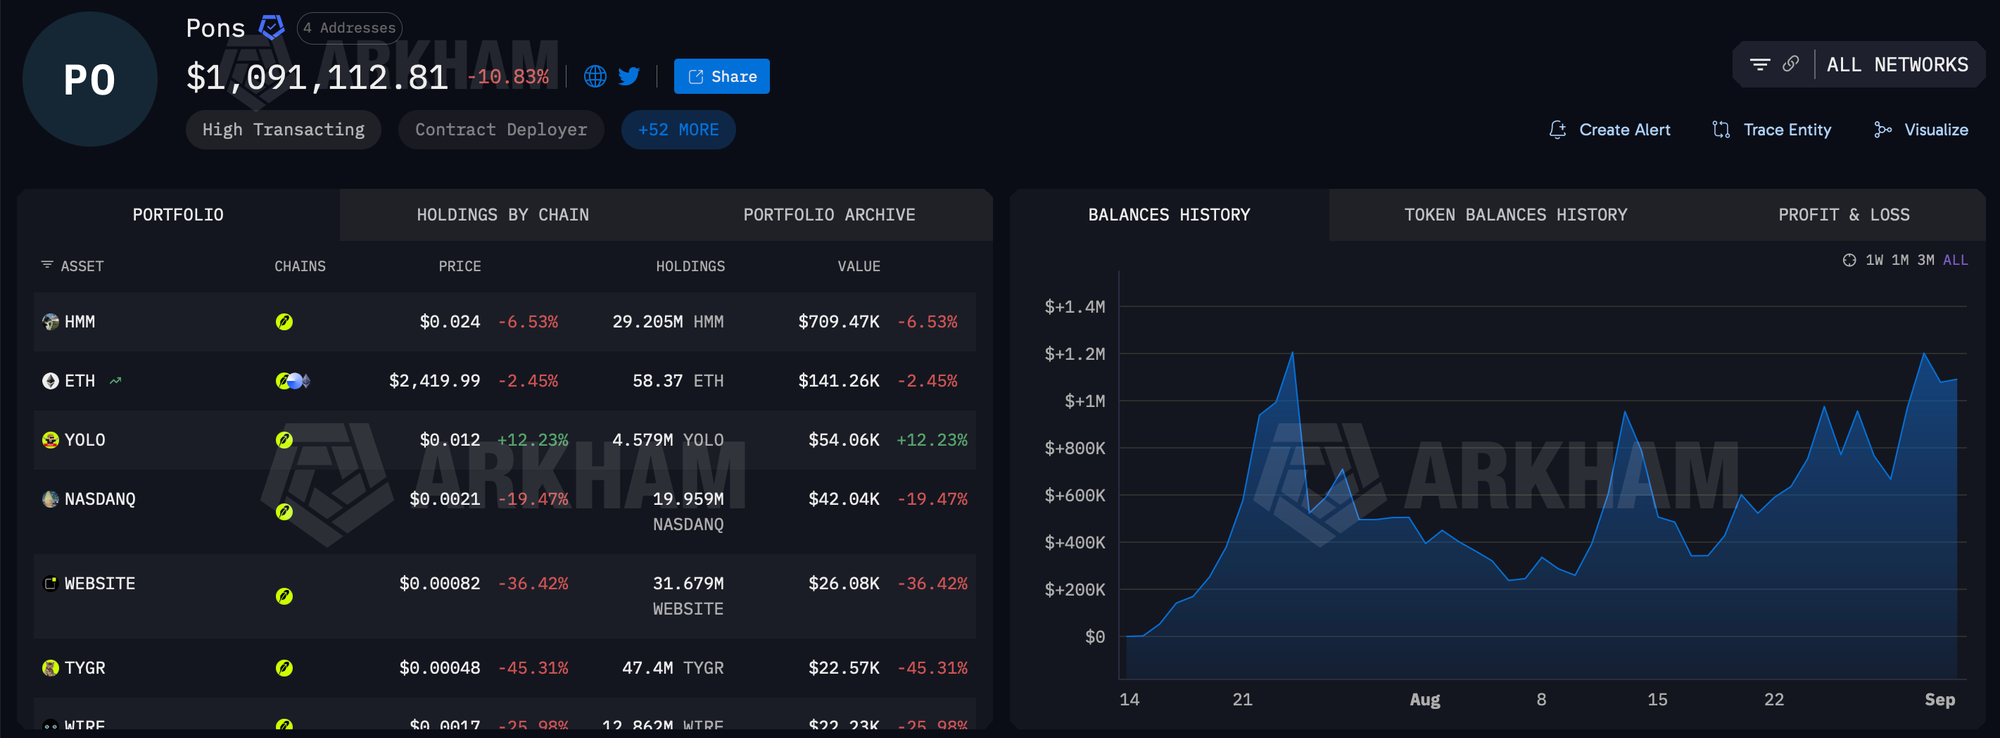
The most interesting example: Artificial Inu (AI), a memecoin paired against tokenized Nvidia stock. It grew from a $1.5 million market cap on August 1 to a peak of $135 million on August 30.
Utility tokens are catching up
While memecoins kicked things off, utility projects are now gaining ground. PONS itself grew from $20 million to over $200 million in market cap this month. Other projects like Delta, UP, and NetNet have all seen 10x valuation increases in August alone.
What it means
Robinhood Chain wasn't supposed to be a memecoin hub. But the market decided otherwise. The chain's success shows that user behavior often trumps design intentions — and that meme-driven liquidity can build serious infrastructure.
Whether the network can sustain this momentum as the memecoin hype fades remains to be seen. For now, Robinhood Chain is one of the most economically active blockchains in crypto, and it got there in record time.