Liquidation cascades explained: How leverage amplifies crypto market moves

Crypto is a heavily leveraged market, where a sharp price move can feed itself. Liquidation cascades, the forced closing of leveraged positions, amplified Bitcoin’s plunge below $64,000 on November 15. They have deepened major sell-offs since 2016, when high-leverage perpetual futures arrived, and automatic liquidation is now a dominant driver of volatility.
TL;DR
- Liquidation cascades start when an exchange force-closes leveraged positions, and the forced trades push the price into the next batch of liquidations.
- Perpetual futures let traders borrow from the exchange. Once a trader’s equity drops below the maintenance margin, the position is liquidated, usually well before the full margin is gone.
- Cascades run in both directions. Long liquidations deepen drops, and short liquidations can fuel a squeeze in a rally.
- Cascades hit hardest when positions are crowded and order books are thin. Shared collateral on cross margin and DeFi lending loops can carry the damage into other markets.
- On October 10-11, 2025, a surprise tariff announcement set off the largest cascade to date, with more than $19 billion in positions liquidated.
- Liquidation data, heatmaps, open interest and funding rates give useful context after a move. None of them works as a standalone trading signal.
When a price move triggers another one
Outside news moves crypto too: Fed rate decisions, geopolitics, AI scandals and energy costs have all sent prices swinging. A sell-off triggered by a headline can become far sharper because of how perpetual futures markets work.
Perpetual contracts, or perps, are the dominant form of crypto derivatives trading. They have no expiration date and stay close to the spot price of the underlying asset through a funding rate. Our guide to crypto perpetuals covers the fundamentals.
Perp traders often use leverage, borrowing from the exchange to open positions worth more than the funds they hold. Leverage amplifies gains and losses alike. Margin trading existed on early exchanges as far back as 2012–2013, but automatic liquidation is what lets a sell-off feed on itself.
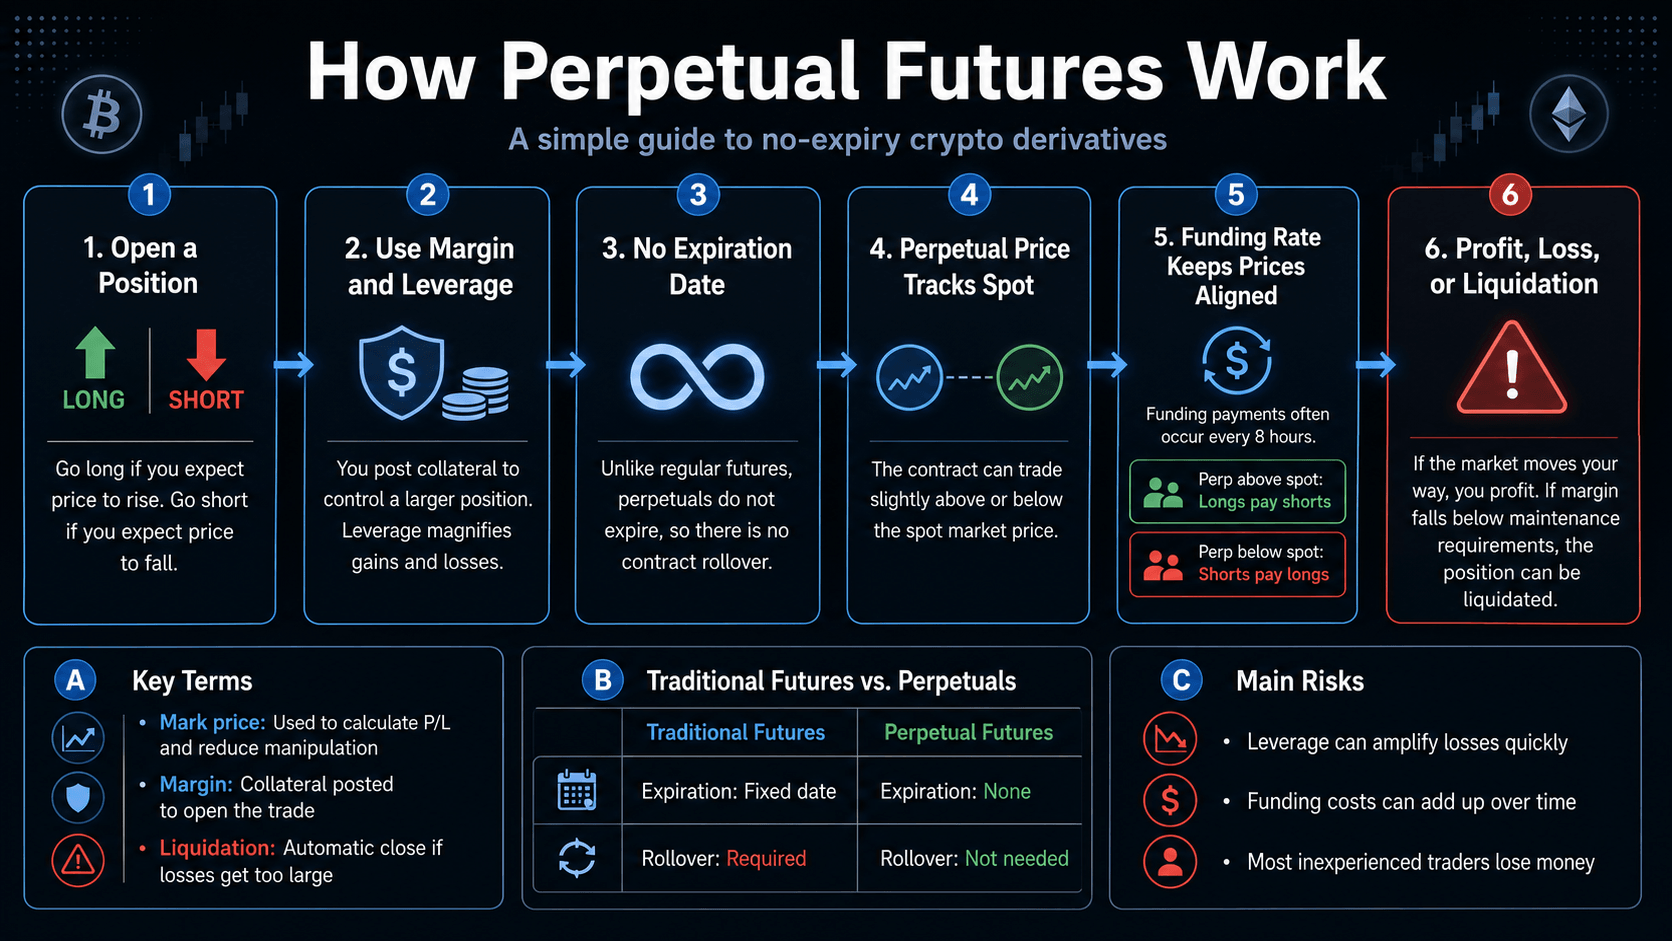
When prices move sharply against a position, losses mount. Once the trader’s collateral can no longer cover them, the exchange forcibly closes the position to protect itself from losses.
This forced selling or buying pushes the price further, and more positions hit their liquidation levels. One such cascade wiped out $19.16 billion on October 10, 2025, after a surprise announcement of US tariffs on Chinese imports.
The consequences reach well beyond individual traders. Cascades magnify volatility, deepening drops and fueling rallies, and they can drain market liquidity and move prices across related assets.
How leveraged positions get liquidated
Liquidation happens when a trader’s margin becomes insufficient to keep a leveraged position open.
Traders who borrow to increase their position size put up their own funds as collateral, known as margin. With 10x leverage, for instance, $1,000 in the account opens a $10,000 position. In today’s perp market, leverage ranges from 1x up to 50x or even 100x, depending on the platform and the asset.
The collateral posted to open a position is the initial margin. To keep the position open, the account’s equity must stay above a minimum level called the maintenance margin, and losses eat into that cushion as the market moves against the trader.
Once the trader’s equity falls below the maintenance margin, the position becomes subject to liquidation. The price at which this happens is called the liquidation price. The exact level depends on the leverage used and on the exchange’s maintenance requirements and fees. It usually sits well before the entire margin is lost.
The type of margin also matters. With isolated margin, only the funds allocated to a specific position are at risk. With cross margin, the exchange can use the trader’s available account balance to support open positions, which can put more of their funds at risk.
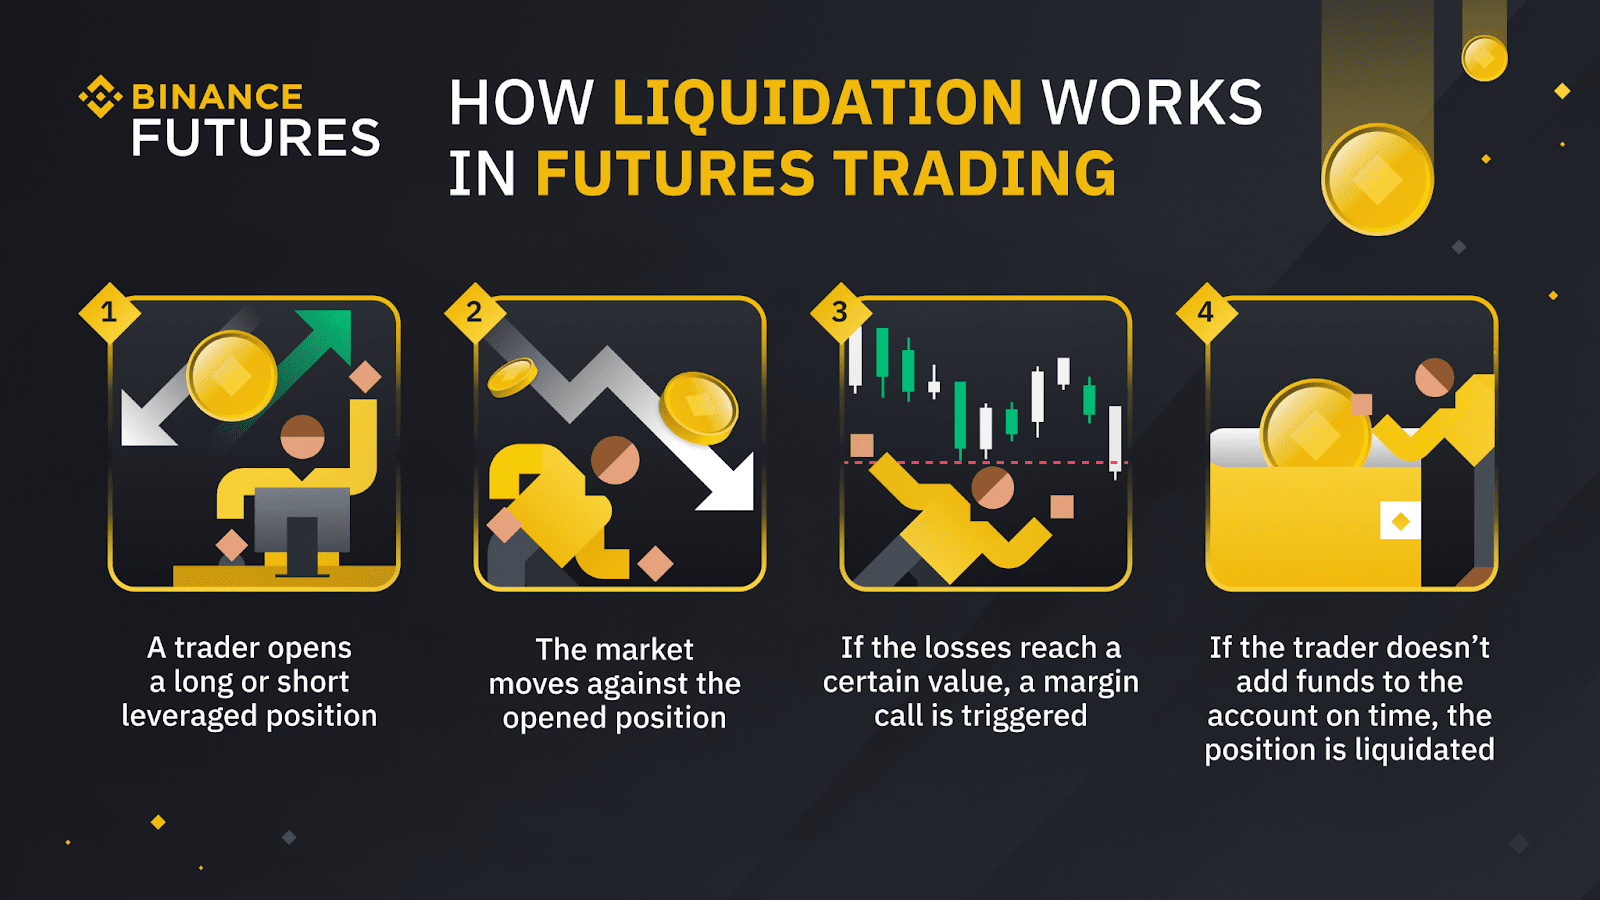
Exchanges typically trigger liquidation off a mark price rather than the platform’s last traded price. The mark price reflects fair value across multiple spot markets, which helps avoid liquidations caused by a sudden spike or drop on a single exchange.
Take the $10,000 position above: a 10% adverse move would erase the full $1,000 in margin, so the exchange liquidates it earlier, at the maintenance level.
What is a liquidation cascade?
Forced closures add trades of their own to the market. In a falling market, closing liquidated longs means selling into the decline. If there isn’t enough buy-side liquidity to absorb those orders, the price drops further and pushes more leveraged positions toward liquidation.
Each round of forced selling pushes prices lower and triggers the next round of liquidations. This feedback loop is a liquidation cascade, and it can turn an ordinary decline into a sharp drop.
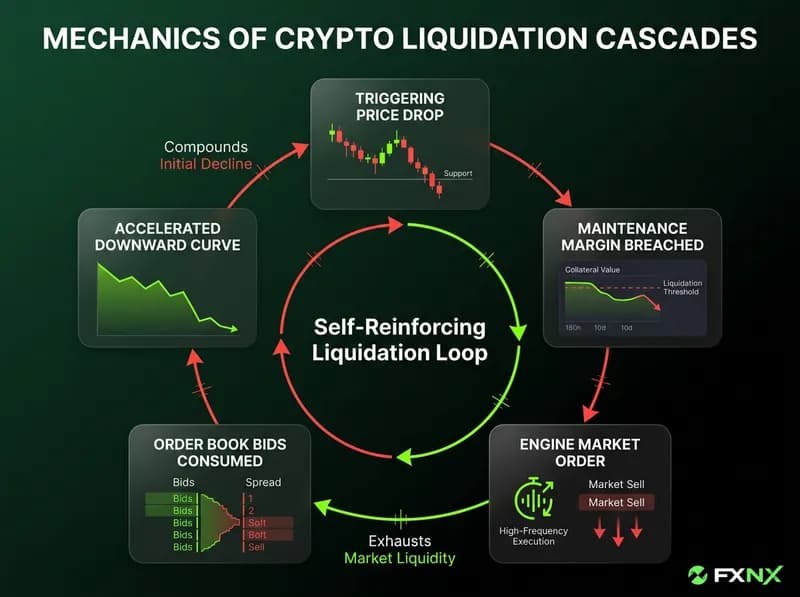
Cascades aren’t limited to falling markets, though. During a rapid rally, liquidations of short positions can create a similar chain reaction known as a short squeeze. Liquidated shorts are closed by buying, which pushes prices higher and triggers further short liquidations.
Why some cascades become more severe
Leverage creates the potential for forced selling, but the damage doesn’t always spread far. Market conditions decide its magnitude.
Excessive leverage (vulnerability)
The higher the leverage, the smaller the adverse move needed to liquidate a position. When many traders use it, a large number of positions sit within the same narrow price range.
Crowded positioning (concentration of risk)
When many traders hold similar positions, their liquidations tend to arrive at roughly the same time and in the same direction.
Thin order books (price impact)
Forced selling moves the price more when too few buy orders sit nearby to absorb it, and forced buying works the same way in reverse. Each liquidated order slips through the book and drives the price toward the next liquidation cluster. Liquidity can also vanish during extreme volatility.
Market-wide exposure (cross-asset contagion)
Bitcoin and major altcoins often fall together in sharp sell-offs. Traders on cross margin share collateral across positions, and some back their trades with volatile assets instead of stablecoins. A loss in one position therefore cuts the margin supporting the others, so liquidations in one market can spread to the rest.
Smart contract loops (DeFi pressure)
On decentralized lending protocols, borrowers use crypto collateral to mint stablecoins or borrow more crypto to buy additional assets. When prices fall below collateral ratios, automated bots liquidate the collateral on exchanges, selling into thin liquidity and pushing spot prices lower.
What happens after a position is liquidated?
An exchange doesn’t always dump the entire position onto the order book when it liquidates it. Platforms handle liquidations differently, and the price pressure varies with the method.
- Partial liquidation applies when reducing the position, without closing it, is enough to restore the required margin. The impact is low to moderate, since order book liquidity can replenish between slices and dampen a cascade.
- Market liquidation means the exchange closes the position through the market. This exerts the highest direct price pressure, causing sharp price wicks and slippage.
- Insurance funds use the exchange’s reserve capital to cover losses when a position is closed at a worse price than its remaining collateral can support. This has no immediate market effect, but it can create delayed pressure if the fund later unwinds an inherited position.
- Auto-deleveraging (ADL) is the last resort when the insurance fund can’t absorb the shortfall. An off-book mechanism matches the losing position against profitable traders on the opposite side at the bankruptcy price. It has no direct market effect, but market makers may be forced to unwind their hedges, which sends sudden volume back into the market and adds indirect volatility.
For example, Binance describes a smart liquidation process that tries to reduce a position before turning to its insurance fund.
Case study: the October 2025 liquidation event
The largest liquidation cascade to date hit on October 10-11, 2025, in an already volatile market. It shows how macro pressure and crypto’s leveraged market structure feed each other.
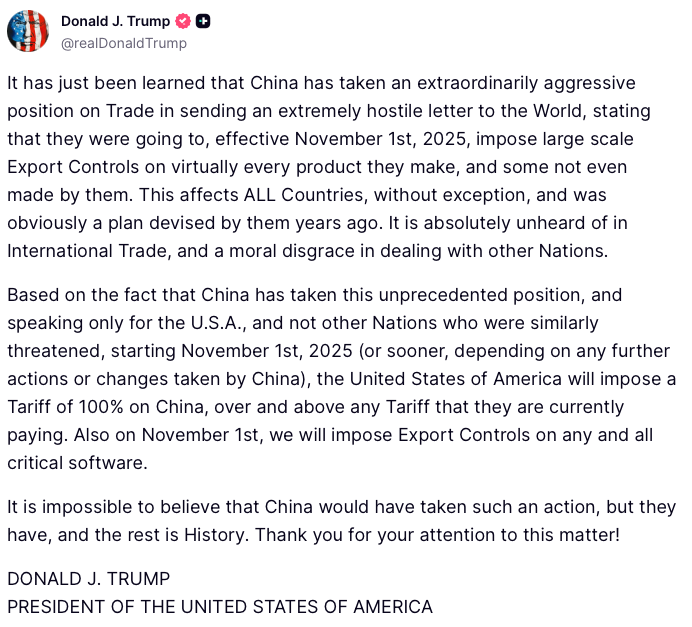
The trigger was a post from President Trump announcing an additional 100% tariff on Chinese imports, after China restricted rare earth exports to the US. Treasury yields were rising (the 10-year at 4.05%) and the dollar was strengthening (DXY up 0.4% week over week).
Bitcoin (BTC) fell 14% to $104,782 and ether (ETH) dropped 15% to $3,447. More than $19 billion in positions were liquidated, affecting over 1.6 million traders. The tariff news set the crash off, and lopsided leverage plus automatic liquidations deepened it. According to one research paper, contagion ran 15% stronger than in the 2018 trade war episode.
An earlier flush hit on April 17, 2021, when rumors of a US Treasury anti-money laundering crackdown and Xinjiang mining blackouts triggered $9.94 billion in liquidations. Bitcoin fell from $55,000 to $48,000 within hours.
How traders can read liquidation activity
Liquidation data helps explain market behavior, but it makes a poor standalone trading signal. Four readings are common, and each has limits. Our guide to Bitcoin liquidations goes deeper.
- Long vs. short liquidations. A burst of long liquidations points to forced selling during a decline, while short liquidations add buying pressure during a rally. Comparing the two shows which direction the forced flow ran.
- Liquidation heatmaps. These tools estimate the price levels where leveraged positions are vulnerable, based on assumptions about leverage and margin type. They are estimates and don’t show confirmed liquidation orders in real time.
- Open interest. A sharp drop in open interest alongside a price move suggests positions are being closed. It doesn’t prove liquidations caused the move, since traders also close positions voluntarily.
- Funding rates. Persistently positive funding, with longs paying shorts, shows positioning skewed toward longs, and persistently negative funding shows the reverse. Funding says nothing about where liquidation levels sit.
Reported liquidation totals are lagging data, so they explain a move after the fact. They are best read alongside price action, trading volume, open interest and liquidity conditions.
Leverage can turn volatility into a feedback loop
Liquidations are how leveraged derivatives markets contain risk, closing positions before losses exceed the collateral behind them. Trouble starts when many positions become vulnerable at once and the forced closures add pressure to a market that is already moving.
How severe the impact gets depends on how deep market liquidity is and how each exchange handles liquidations. A liquidation spike explains part of a move, and other market data has to cover the rest. Understanding a cascade starts with the structure of the market, since no single trade explains it.